First Busey Results Presentation Deck
2Q23 Earnings Investor Presentation
First Busey Corporation | Ticker: BUSE
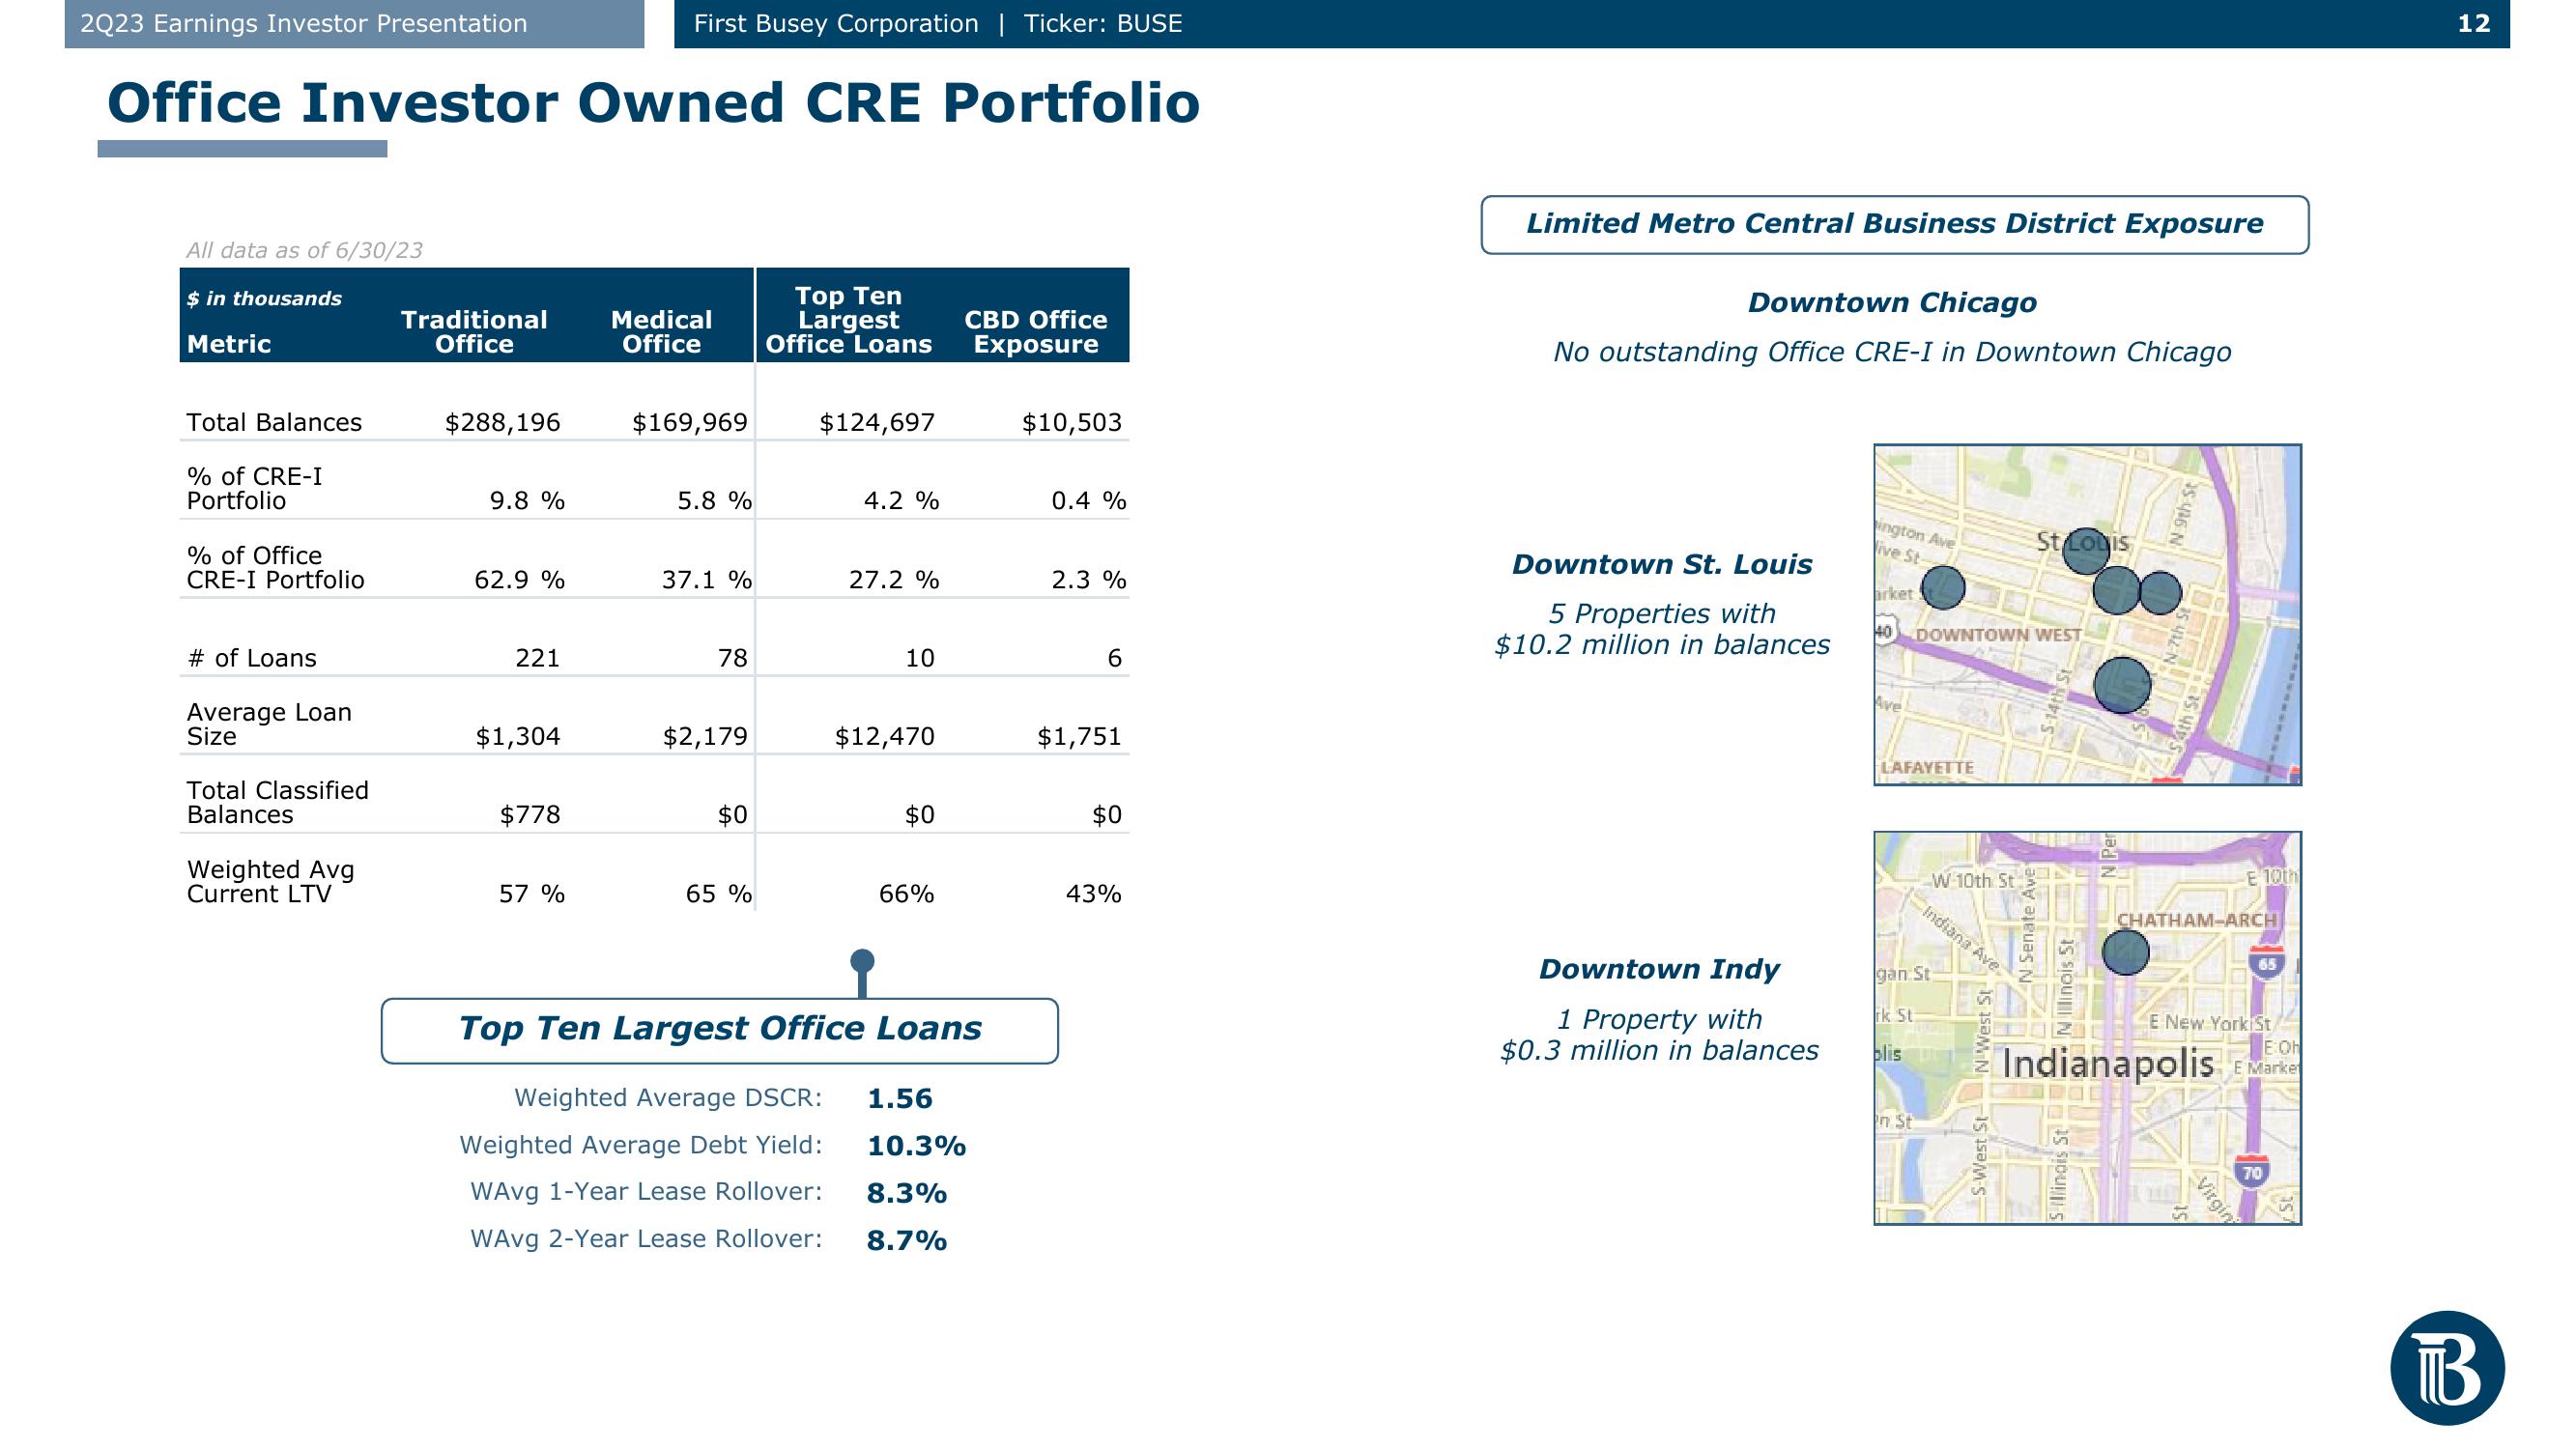
Office Investor Owned CRE Portfolio
All data as of 6/30/23
$ in thousands
Metric
Total Balances
% of CRE-I
Portfolio
% of Office
CRE-I Portfolio
# of Loans
Average Loan
Size
Total Classified
Balances
Weighted Avg
Current LTV
Traditional
Office
$288,196
9.8 %
62.9 %
221
$1,304
$778
57 %
Medical
Office
$169,969
5.8 %
37.1 %
78
$2,179
$0
65 %
Top Ten
Largest
Office Loans
$124,697
4.2 %
Weighted Average Debt Yield:
WAvg 1-Year Lease Rollover:
WAvg 2-Year Lease Rollover:
27.2 %
10
$12,470
$0
66%
CBD Office
Exposure
Top Ten Largest Office Loans
Weighted Average DSCR: 1.56
10.3%
8.3%
8.7%
$10,503
0.4 %
2.3 %
6
$1,751
$0
43%
Limited Metro Central Business District Exposure
Downtown Chicago
No outstanding Office CRE-I in Downtown Chicago
Downtown St. Louis
5 Properties with
$10.2 million in balances
Downtown Indy
1 Property with
$0.3 million in balances
ington Ave
Vive St-
arket
40 DOWNTOWN WEST
Ave
LAFAYETTE
W 10th St
In St
gan St
rk St.
blis p
Indiana Ave.
IN Senate Ave
S-West St N West St
St Louis
N'Illinois St
SIllinois St
N 9th St
CHATHAM-ARCH
E 10th
CALEY
E New York St
E:Oh
Indianapolis Marke
KA
Virgin
710
12
BView entire presentation