J.P.Morgan Results Presentation Deck
JPMORGAN CHASE & CO.
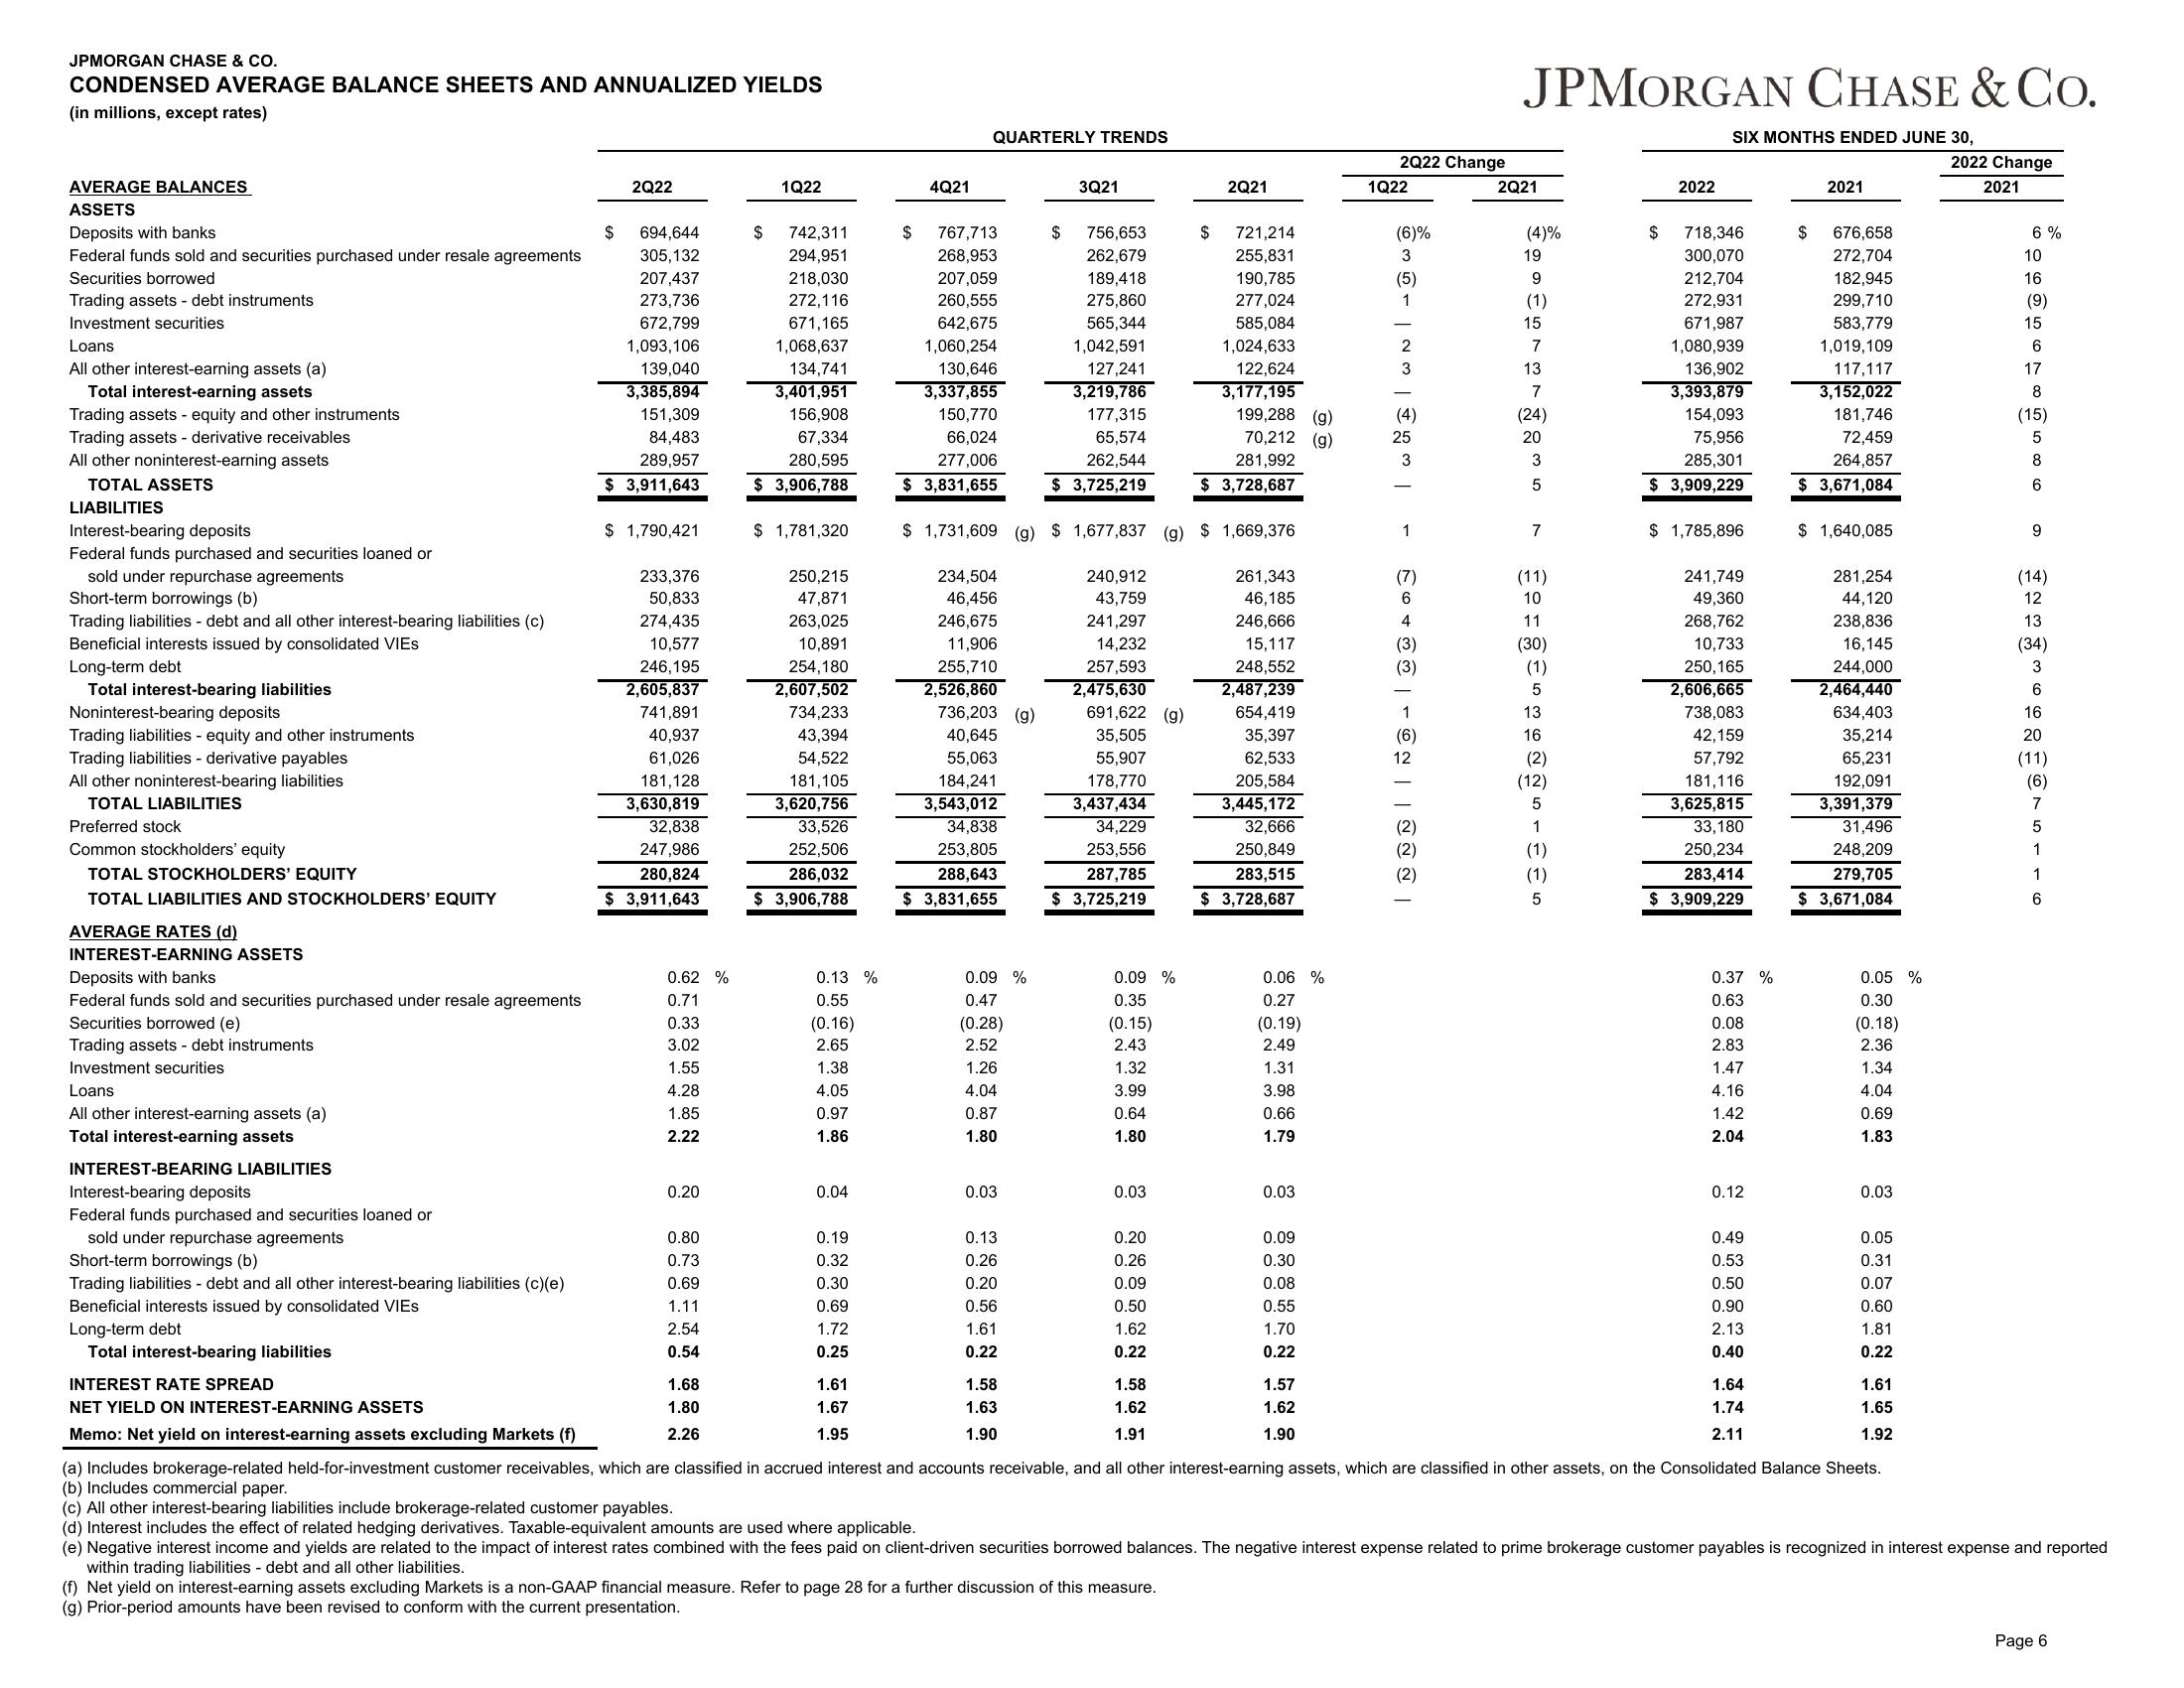
CONDENSED AVERAGE BALANCE SHEETS AND ANNUALIZED YIELDS
(in millions, except rates)
AVERAGE BALANCES
ASSETS
Deposits with banks
Federal funds sold and securities purchased under resale agreements
Securities borrowed
Trading assets - debt instruments
Investment securities
Loans
All other interest-earning assets (a)
Total interest-earning assets
Trading assets - equity and other instruments
Trading assets - derivative receivables
All other noninterest-earning assets
TOTAL ASSETS
LIABILITIES
Interest-bearing deposits
Federal funds purchased and securities loaned or
sold under repurchase agreements
Short-term borrowings (b)
Trading liabilities - debt and all other interest-bearing liabilities (c)
Beneficial interests issued by consolidated VIES
Long-term debt
Total interest-bearing liabilities
Noninterest-bearing deposits
Trading liabilities - equity and other instruments
Trading liabilities - derivative payables
All other noninterest-bearing liabilities
TOTAL LIABILITIES
Preferred stock
Common stockholders' equity
TOTAL STOCKHOLDERS' EQUITY
TOTAL LIABILITIES AND STOCKHOLDERS' EQUITY
AVERAGE RATES (d)
INTEREST-EARNING ASSETS
Deposits with banks
Federal funds sold and securities purchased under resale agreements
Securities borrowed (e)
Trading assets - debt instruments
Investment securities
Loans
All other interest-earning assets (a)
Total interest-earning assets
INTEREST-BEARING LIABILITIES
Interest-bearing deposits
Federal funds purchased and securities loaned or
sold under repurchase agreements
Short-term borrowings (b)
Trading liabilities - debt and all other interest-bearing liabilities (c)(e)
Beneficial interests issued by consolidated VIES
Long-term debt
Total interest-bearing liabilities
INTEREST RATE SPREAD
NET YIELD ON INTEREST-EARNING ASSETS
Memo: Net yield on interest-earning assets excluding Markets (f)
$
2Q22
694,644
305,132
207,437
273,736
672,799
1,093,106
139,040
3,385,894
151,309
84,483
289,957
$ 3,911,643
$ 1,790,421
233,376
50,833
274,435
10,577
246,195
2,605,837
741,891
40,937
61,026
181,128
3,630,819
32,838
247,986
280,824
$ 3,911,643
0.62 %
0.71
0.33
3.02
1.55
4.28
1.85
2.22
0.20
0.80
0.73
0.69
1.11
2.54
0.54
1.68
1.80
2.26
$
1Q22
742,311
294,951
218,030
272,116
671,165
1,068,637
134,741
3,401,951
156,908
67,334
280,595
$ 3,906,788
$ 1,781,320
250,215
47,871
263,025
10,891
254,180
2,607,502
734,233
43,394
54,522
181,105
3,620,756
33,526
252,506
286,032
$ 3,906,788
0.13 %
0.55
(0.16)
2.65
1.38
4.05
0.97
1.86
0.04
0.19
0.32
0.30
0.69
1.72
0.25
1.61
1.67
1.95
4Q21
QUARTERLY TRENDS
$ 767,713
268,953
207,059
260,555
642,675
1,060,254
130,646
3,337,855
150,770
66,024
277,006
$ 3,831,655
234,504
46,456
246,675
11,906
255,710
2,526,860
736,203 (g)
40,645
55,063
184,241
3,543,012
34,838
253,805
288,643
$ 3,831,655
0.09 %
0.47
(0.28)
2.52
1.26
4.04
0.87
1.80
0.03
0.13
0.26
0.20
0.56
1.61
0.22
$
1.58
1.63
1.90
3Q21
$ 1,731,609 (g) $1,677,837 (g) $ 1,669,376
261,343
46,185
246,666
15,117
248,552
2,487,239
654,419
35,397
62,533
205,584
3,445,172
32,666
250,849
283,515
$ 3,728,687
756,653
262,679
189,418
275,860
565,344
1,042,591
127,241
3,219,786
177,315
65,574
262,544
$ 3,725,219
240,912
43,759
241,297
14,232
257,593
2,475,630
691,622 (g)
35,505
55,907
178,770
3,437,434
34,229
253,556
287,785
$ 3,725,219
0.09 %
0.35
(0.15)
2.43
1.32
3.99
0.64
1.80
0.03
0.20
0.26
0.09
0.50
1.62
0.22
2Q21
1.58
1.62
1.91
$ 721,214
255,831
190,785
277,024
585,084
1,024,633
122,624
3,177,195
199,288 (g)
70,212 (g)
281,992
$ 3,728,687
0.06 %
0.27
(0.19)
2.49
1.31
3.98
0.66
1.79
0.03
0.09
0.30
0.08
0.55
1.70
0.22
1.57
1.62
1.90
2Q22 Change
1Q22
(6)%
3
(5)
1
2
3
(4)
I wo
1
Fo+ | | | |
JPMORGAN CHASE & CO.
SIX MONTHS ENDED JUNE 30,
2Q21
(4)%
19
(1)
15
13
(24)
20
✓
(11)
10
11
(30)
(1)
5
13
16
(2)
(12)
5
1
(1)
(1)
5
$
2022
718,346
300,070
212,704
272,931
671,987
1,080,939
136,902
3,393,879
154,093
75,956
285,301
$ 3,909,229
$ 1,785,896
241,749
49,360
268,762
10,733
250,165
2,606,665
738,083
42,159
57,792
181,116
3,625,815
33,180
250,234
283,414
$ 3,909,229
0.37 %
0.63
0.08
2.83
1.47
4.16
1.42
2.04
0.12
0.49
0.53
0.50
0.90
2.13
0.40
1.64
1.74
2.11
$
2021
676,658
272,704
182,945
299,710
583,779
1,019,109
117,117
3,152,022
181,746
72,459
264,857
$ 3,671,084
$ 1,640,085
281,254
44,120
238,836
16,145
244,000
2,464,440
634,403
35,214
65,231
192,091
3,391,379
31,496
248,209
279,705
$ 3,671,084
0.05 %
0.30
(0.18)
2.36
1.34
4.04
0.69
1.83
0.03
0.05
0.31
0.07
0.60
1.81
0.22
1.61
1.65
1.92
(a) Includes brokerage-related held-for-investment customer receivables, which are classified in accrued interest and accounts receivable, and all other interest-earning assets, which are classified in other assets, on the Consolidated Balance Sheets.
(b) Includes commercial paper.
2022 Change
2021
6%
10
16
(9)
15
ܗ ܐ ܣ ܟ ܗ ܣ ܗ
(15)
9
(14)
12
13
(34)
16
20
(11)
(6)
TATTO
(c) All other interest-bearing liabilities include brokerage-related customer payables.
(d) Interest includes the effect of related hedging derivatives. Taxable-equivalent amounts are used where applicable.
(e) Negative interest income and yields are related to the impact of interest rates combined with the fees paid on client-driven securities borrowed balances. The negative interest expense related to prime brokerage customer payables is recognized in interest expense and reported
within trading liabilities - debt and all other liabilities.
(f) Net yield on interest-earning assets excluding Markets is a non-GAAP financial measure. Refer to page 28 for a further discussion of this measure.
(g) Prior-period amounts have been revised to conform with the current presentation.
Page 6View entire presentation