LiveVox Results Presentation Deck
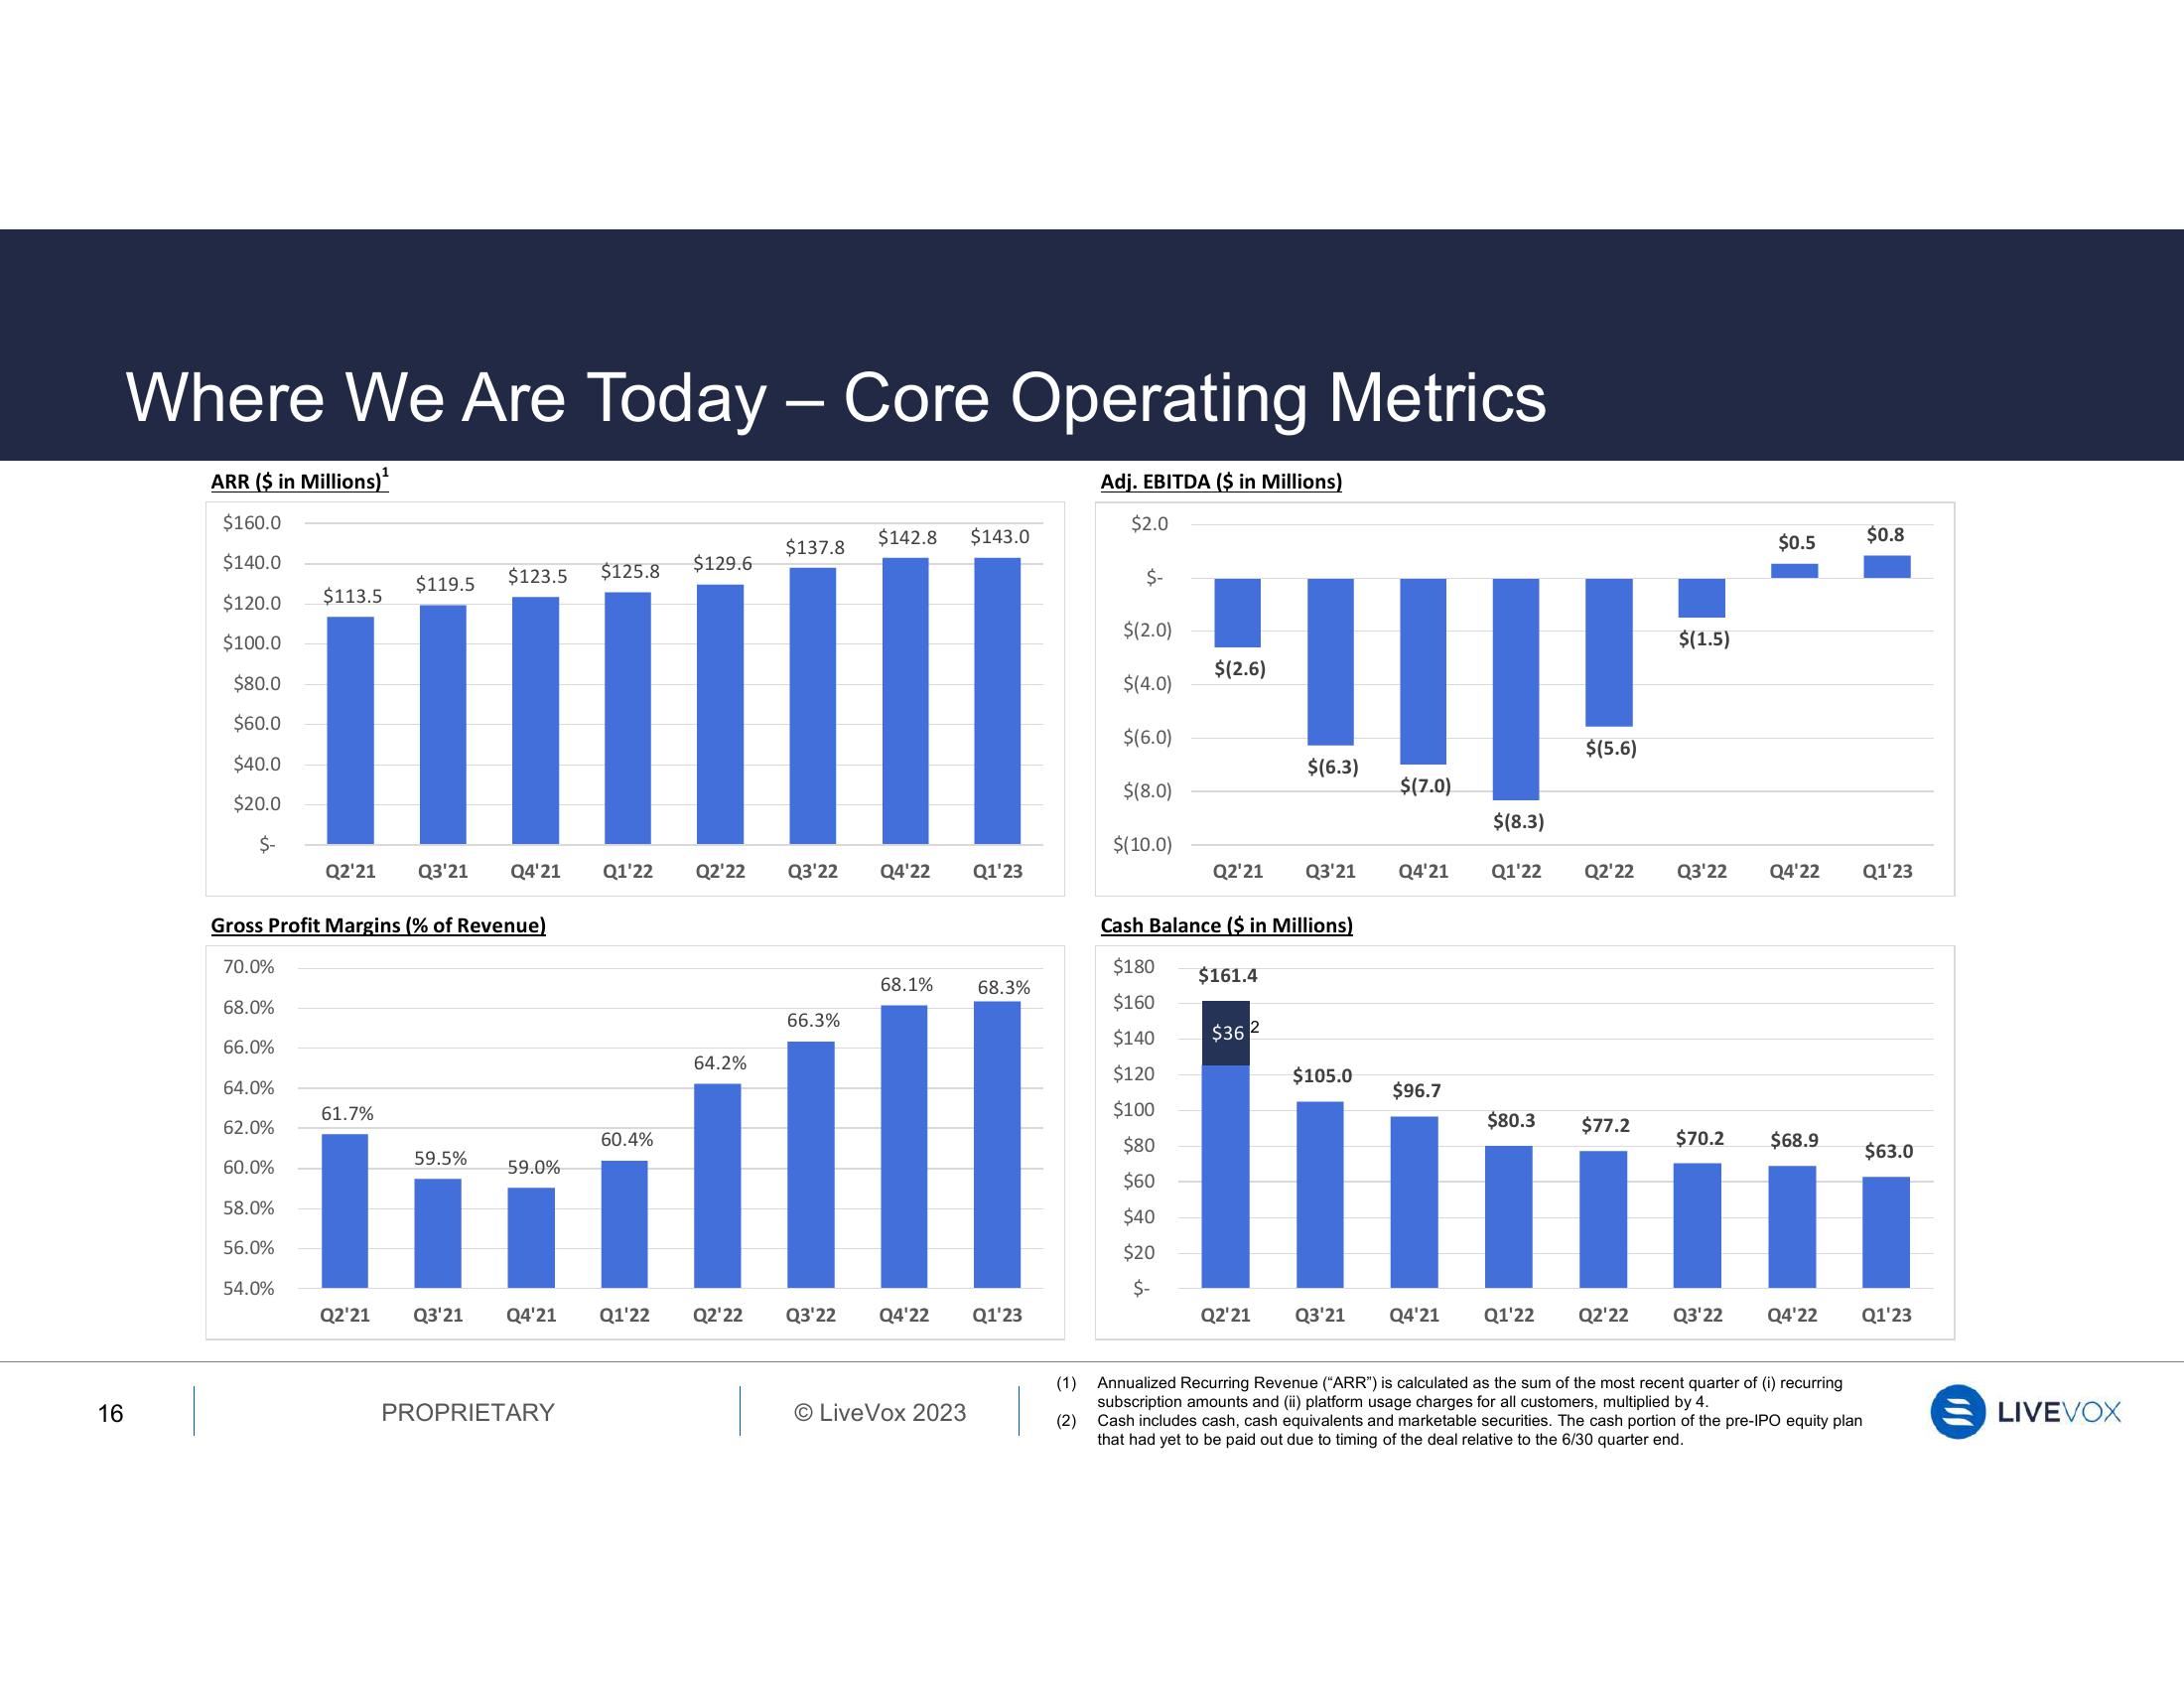
Where We Are Today - Core Operating Metrics
ARR ($ in Millions) ¹
$160.0
$140.0
$120.0
$100.0
$80.0
$60.0
$40.0
$20.0
$-
16
70.0%
68.0%
66.0%
64.0%
Gross Profit Margins (% of Revenue)
62.0%
60.0%
58.0%
56.0%
54.0%
$113.5
11
Q2'21
$119.5
61.7%
$123.5 $125.8
59.5%
Q3'21 Q4'21 Q1'22 Q2'22 Q3'22 Q4'22 Q1'23
59.0%
60.4%
Q2'21 Q3'21 Q4'21 Q1'22
PROPRIETARY
$129.6
64.2%
$137.8
Q2'22
$142.8 $143.0
66.3%
68.1%
68.3%
Q3'22 Q4'22 Q1'23
O LiveVox 2023
Adj. EBITDA ($ in Millions)
$2.0
$-
$(2.0)
$(4.0)
$(6.0)
$(8.0)
$(10.0)
$(2.6)
$80
$60
$40
$20
$-
$(6.3)
Q2'21 Q3'21
Cash Balance ($ in Millions)
$180 $161.4
$160
$140
$120
$100
$362
$105.0
$(7.0)
Q4'21
$96.7
$80.3
$(5.6)
Q2¹21 Q3'21 Q4'21 Q1'22
$(8.3)
Q1'22 Q2'22 Q3'22 Q4'22 Q1'23
$77.2
$(1.5)
$0.5
$70.2
III
Q3'22
Q2'22
$68.9
$0.8
(1) Annualized Recurring Revenue ("ARR") is calculated as the sum of the most recent quarter of (i) recurring
subscription amounts and (ii) platform usage charges for all customers, multiplied by 4.
(2)
Cash includes cash, cash equivalents and marketable securities. The cash portion of the pre-IPO equity plan
that had yet to be paid out due to timing of the deal relative to the 6/30 quarter end.
$63.0
Q4'22 Q1'23
LIVEVOXView entire presentation