Massachusetts Water Resources Authority (“MWRA”) Employees’ Retirement System
APPENDIX
Representative Investment
ASML Holding (ASML NA) World's dominant producer of semiconductor lithography machines
ASML is the world's dominant producer of semiconductor lithography machines,
which "project" ever-more complex and miniature circuit patterns onto silicon
wafers, thus effectively sustaining Moore's Law (which states that the number of
components and transistors on a chip should double every two years). Free float is
95%.
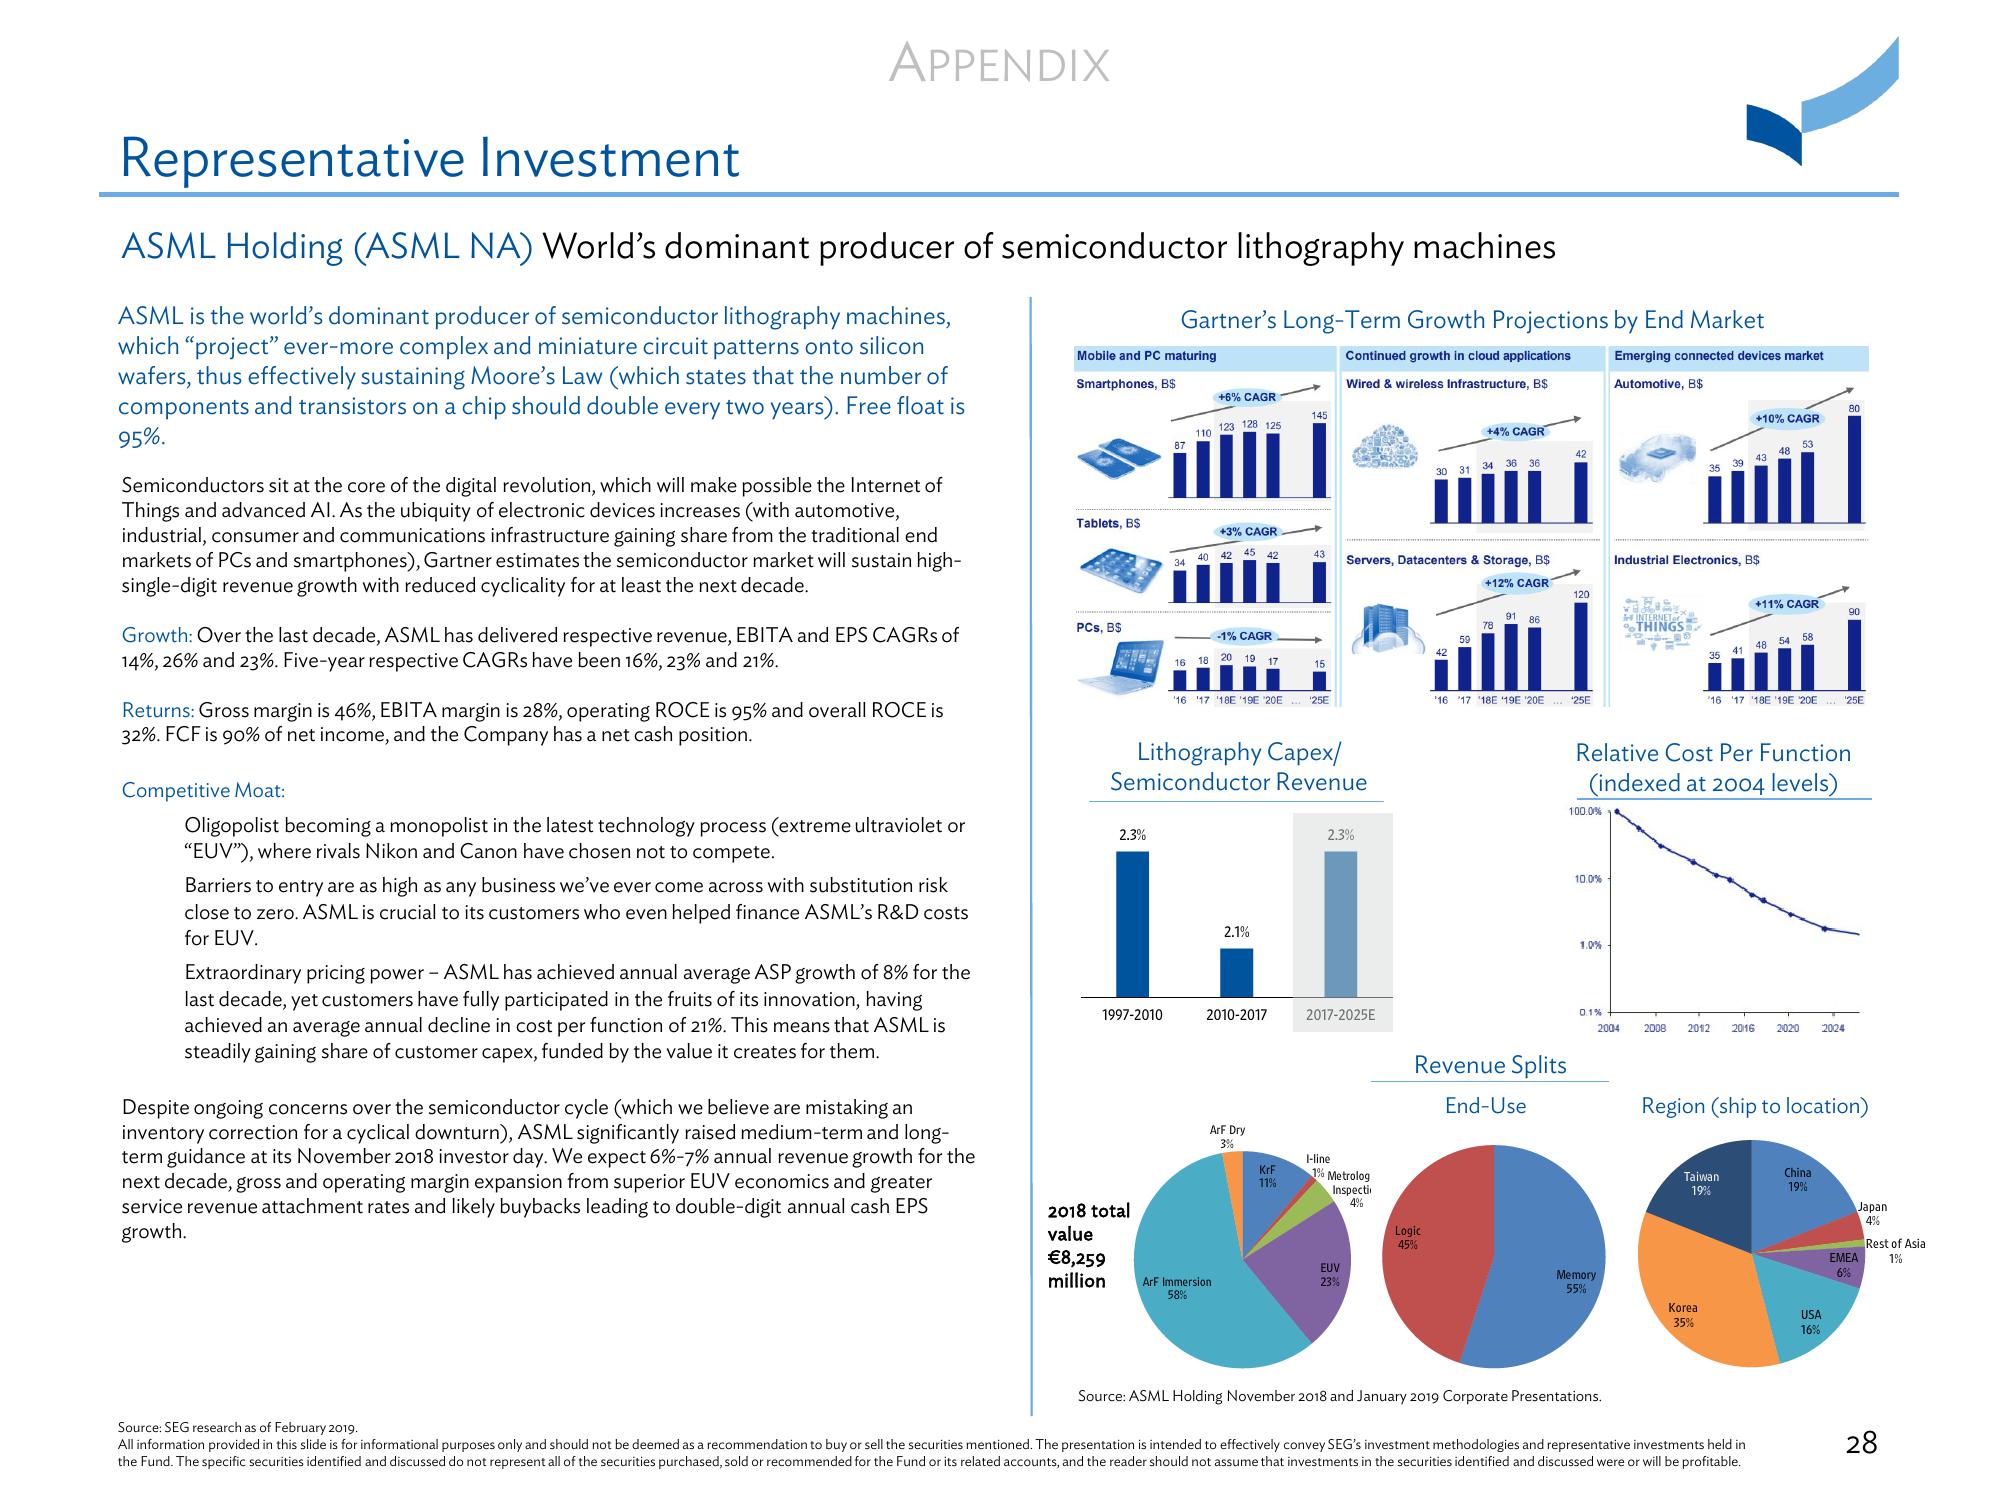
Semiconductors sit at the core of the digital revolution, which will make possible the Internet of
Things and advanced Al. As the ubiquity of electronic devices increases (with automotive,
industrial, consumer and communications infrastructure gaining share from the traditional end
markets of PCs and smartphones), Gartner estimates the semiconductor market will sustain high-
single-digit revenue growth with reduced cyclicality for at least the next decade.
Growth: Over the last decade, ASML has delivered respective revenue, EBITA and EPS CAGRs of
14%, 26% and 23%. Five-year respective CAGRs have been 16%, 23% and 21%.
Returns: Gross margin is 46%, EBITA margin is 28%, operating ROCE is 95% and overall ROCE is
32%. FCF is 90% of net income, and the Company has a net cash position.
Competitive Moat:
Oligopolist becoming a monopolist in the latest technology process (extreme ultraviolet or
"EUV"), where rivals Nikon and Canon have chosen not to compete.
Barriers to entry are as high as any business we've ever come across with substitution risk
close to zero. ASML is crucial to its customers who even helped finance ASML's R&D costs
for EUV.
Extraordinary pricing power - ASML has achieved annual average ASP growth of 8% for the
last decade, yet customers have fully participated in the fruits of its innovation, having
achieved an average annual decline in cost per function of 21%. This means that ASML is
steadily gaining share of customer capex, funded by the value it creates for them.
Despite ongoing concerns over the semiconductor cycle (which we believe are mistaking an
inventory correction for a cyclical downturn), ASML significantly raised medium-term and long-
term guidance at its November 2018 investor day. We expect 6%-7% annual revenue growth for the
next decade, gross and operating margin expansion from superior EUV economics and greater
service revenue attachment rates and likely buybacks leading to double-digit annual cash EPS
growth.
Mobile and PC maturing
Smartphones, B$
Tablets, BS
PCs, B$
FI-2
2.3%
Gartner's Long-Term Growth Projections by End Market
Continued growth in cloud applications
Wired & wireless Infrastructure, B$
1997-2010
2018 total
value
€8,259
million
87
+6% CAGR
110 123 128 125
16 18
+3% CAGR
42 45 42
-1% CAGR
20 19
ArF Immersion
58%
Lithography Capex/
Semiconductor Revenue
2.1%
2010-2017
17
16 17 18E 19E '20E ¹25E
ArF Dry
3%
145
43
KrF
11%
15
2.3%
2017-2025E
I-line
1% Metrolog
Inspecti
4%
EUV
23%
Servers, Datacenters & Storage, B$
+12% CAGR
30 31
+4% CAGR
Logic
45%
34
36
78
91 86
42
Revenue Splits
End-Use
120
16 17 18E 19E '20E 25E
100.0%
10.0%
1.0%
0.1%
Emerging connected devices market
Automotive, B$
Memory
55%
2004
Source: ASML Holding November 2018 and January 2019 Corporate Presentations.
Industrial Electronics, B$
INTERNET
THINGS
Relative Cost Per Function
(indexed at 2004 levels)
35 41
+10% CAGR
53
43 48
Korea
35%
Taiwan
19%
+11% CAGR
48 54 58
16 17 18E 19E 20E ¹25E
2008 2012 2016 2:02:0 2024
Source: SEG research as of February 2019.
All information provided in this slide is for informational purposes only and should not be deemed as a recommendation to buy or sell the securities mentioned. The presentation is intended to effectively convey SEG's investment methodologies and representative investments held in
the Fund. The specific securities identified and discussed do not represent all of the securities purchased, sold or recommended for the Fund or its related accounts, and the reader should not assume that investments in the securities identified and discussed were or will be profitable.
Region (ship to location)
90
China
19%
USA
16%
Japan
4%
EMEA
6%
Rest of Asia
1%
28View entire presentation