First Busey Results Presentation Deck
1.
2.
3.
4Q23 Earnings Investor Presentation
Non-GAAP Financial Information
First Busey Corporation | Ticker: BUSE
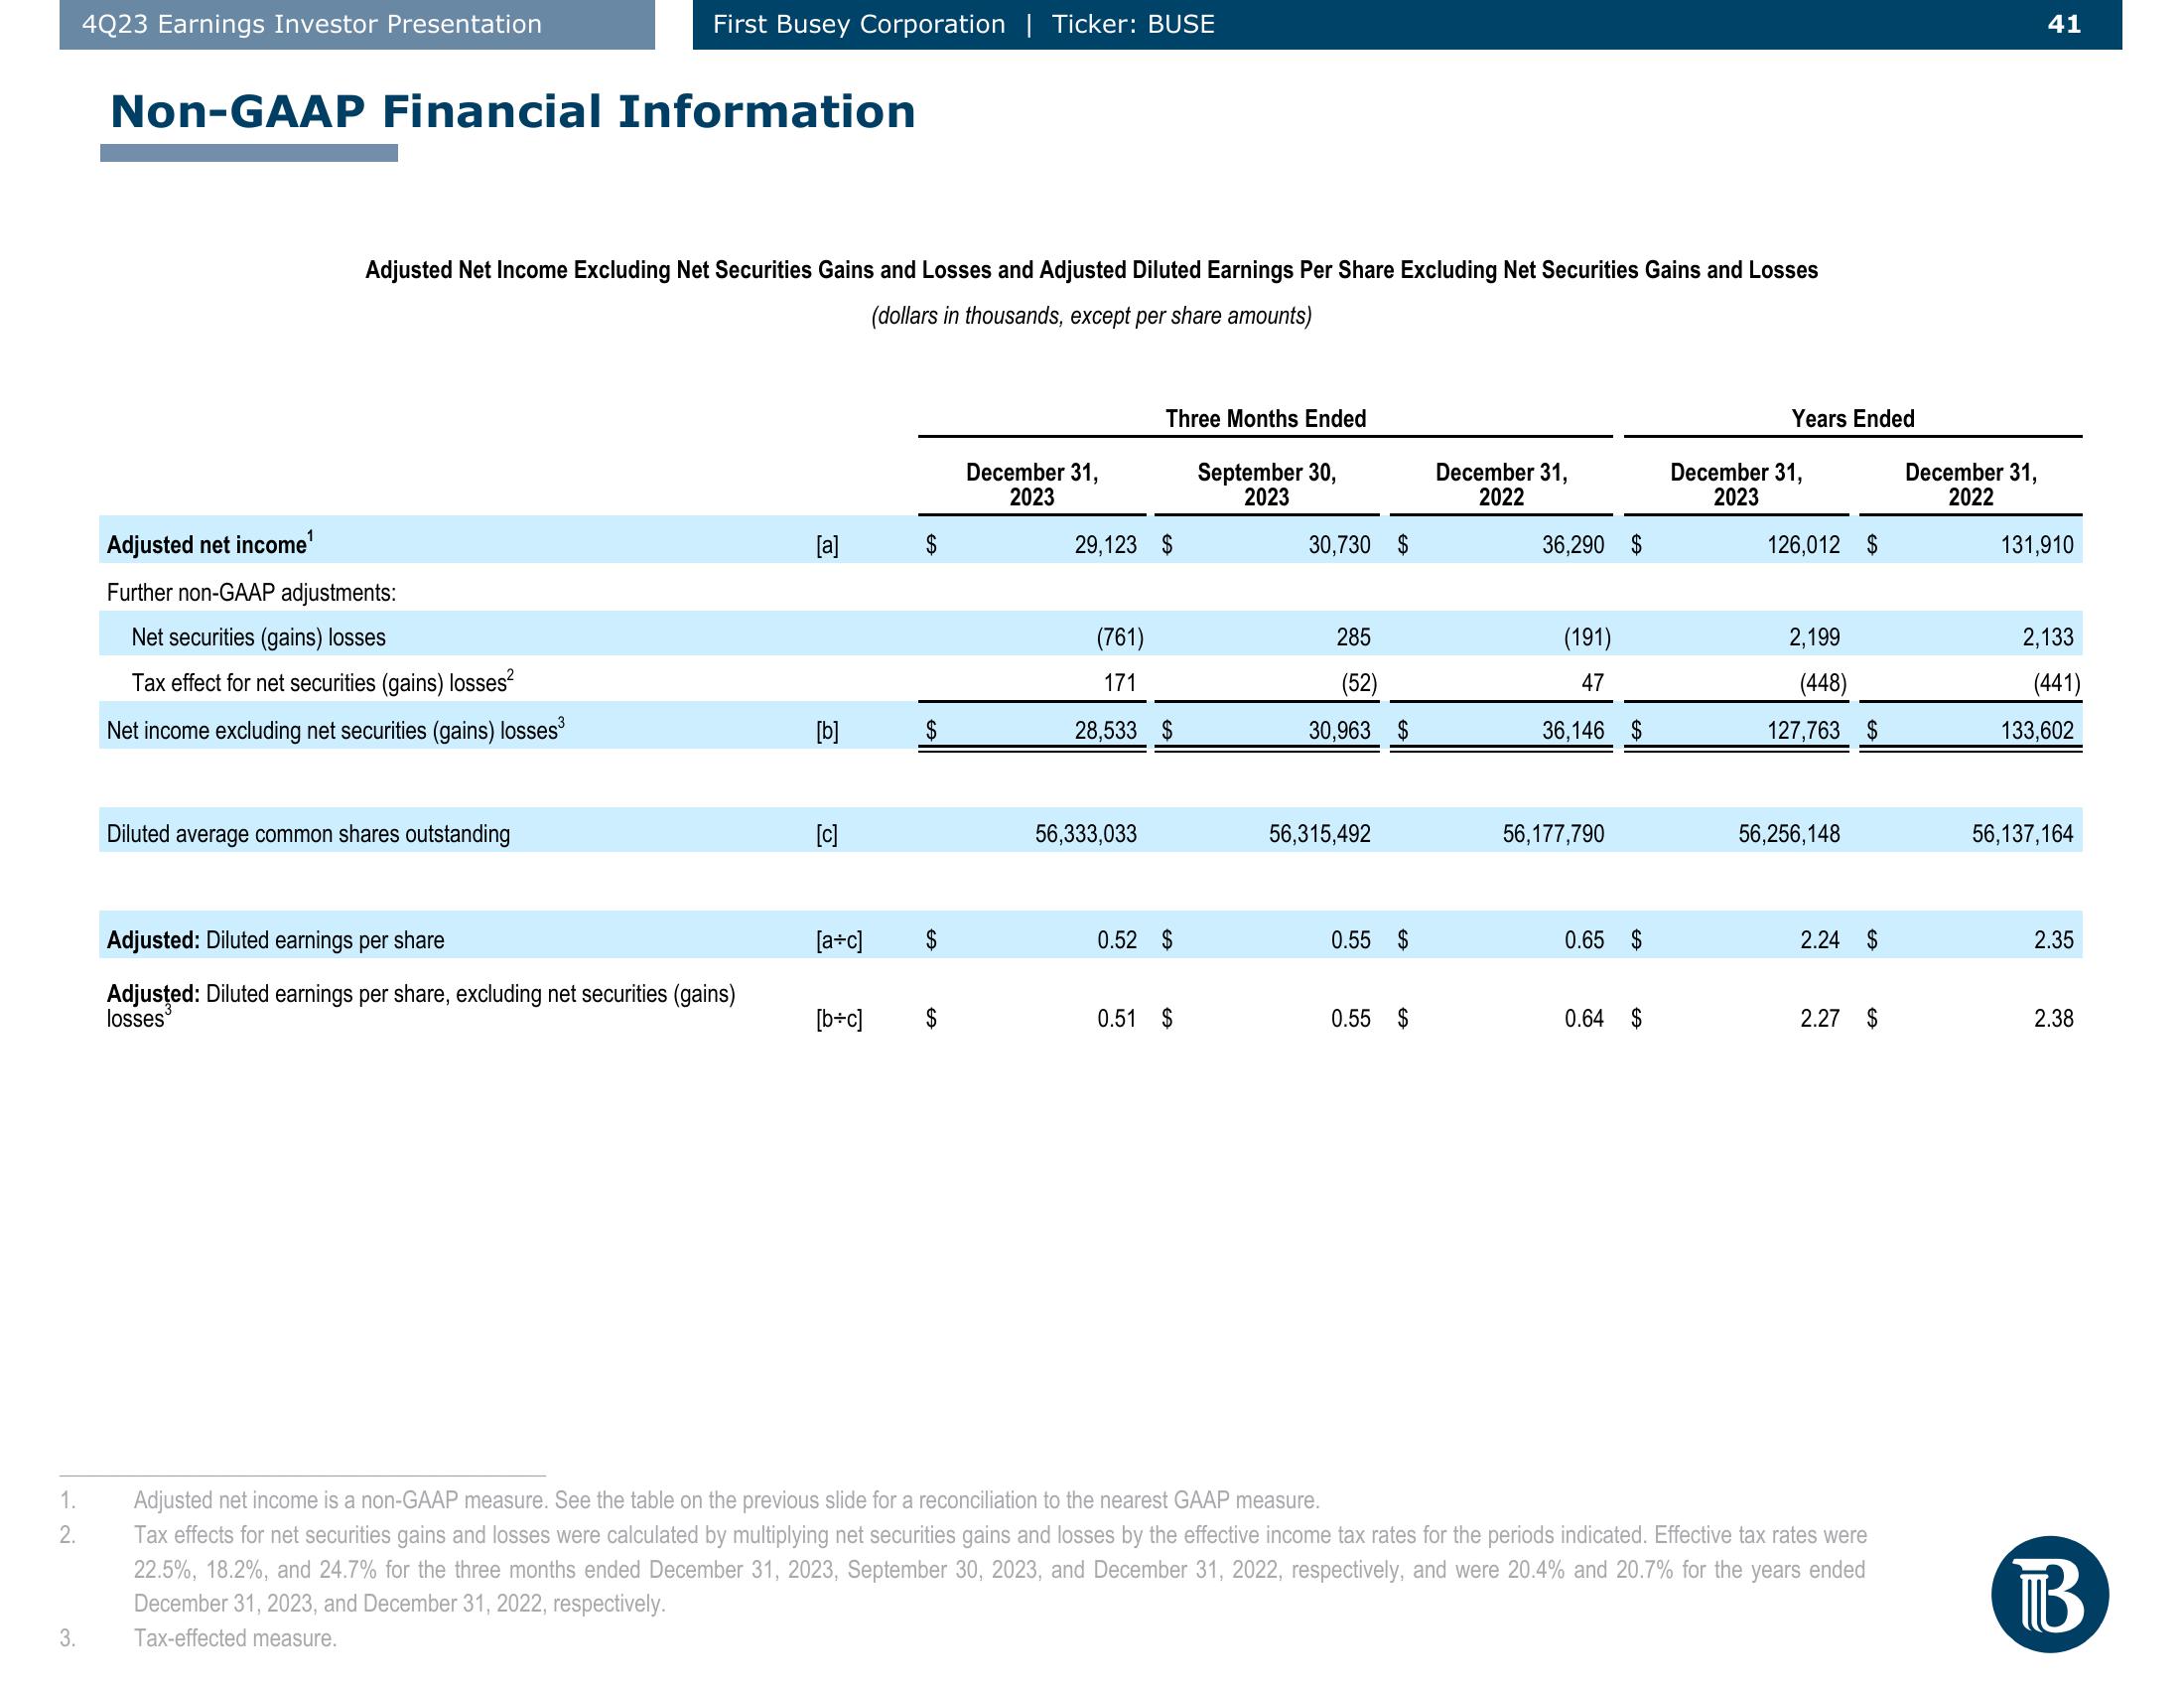
Adjusted Net Income Excluding Net Securities Gains and Losses and Adjusted Diluted Earnings Per Share Excluding Net Securities Gains and Losses
(dollars in thousands, except per share amounts)
Adjusted net income¹
Further non-GAAP adjustments:
Net securities (gains) losses
Tax effect for net securities (gains) losses²
Net income excluding net securities (gains) losses³
Diluted average common shares outstanding
Adjusted: Diluted earnings per share
Adjusted: Diluted earnings per share, excluding net securities (gains)
losses
[a]
[b]
[c]
[a+c]
$
$
$
[b+c] $
December 31,
2023
Three Months Ended
September 30,
2023
29,123 $
(761)
171
28,533 $
56,333,033
0.52 $
0.51 $
30,730 $
285
(52)
30,963 $
56,315,492
0.55 $
0.55 $
December 31,
2022
36,290 $
(191)
47
36,146 $
56,177,790
0.65 $
0.64
$
Years Ended
December 31,
2023
126,012 $
2,199
(448)
127,763 $
56,256,148
2.24 $
2.27 $
Adjusted net income is a non-GAAP measure. See the table on the previous slide for a reconciliation to the nearest GAAP measure.
Tax effects for net securities gains and losses were calculated by multiplying net securities gains and losses by the effective income tax rates for the periods indicated. Effective tax rates were
22.5%, 18.2%, and 24.7% for the three months ended December 31, 2023, September 30, 2023, and December 31, 2022, respectively, and were 20.4% and 20.7% for the years ended
December 31, 2023, and December 31, 2022, respectively.
Tax-effected measure.
December 31,
2022
41
131,910
2,133
(441)
133,602
56,137,164
2.35
2.38
BView entire presentation