Tesla Results Presentation Deck
7
VEHICLE CAPACITY
In Q2, we achieved record production rates across the company. However, we saw a
continuation of manufacturing challenges related to shutdowns, global supply chain
disruptions, labor shortages and logistics and other complications, which limited our
ability to consistently run our factories at full capacity.
US: California and Texas
Our Fremont Factory made a record number of vehicles in Q2. We see opportunities
for further production rate improvements. In Texas, we have added flexibility to
produce vehicles with either a structural battery pack or legacy battery pack. The
next generation of 4680 battery cell machinery has been installed in Texas and is in
the process of commissioning. Factory output in Texas continues to grow.
China: Shanghai
While the Shanghai factory was shut down fully and then partially for the majority of
Q2, we ended the quarter with a record monthly production level. Recent equipment
upgrades will enable us to continue to increase our production rate further.
Europe: Berlin-Brandenburg
Thanks to strong production rate improvement towards the end of Q2, our team in
Germany produced more than 1,000 Model Y vehicles in a single week, using 2170
cells. We expect the production rate to continue improving through the rest of the
year.
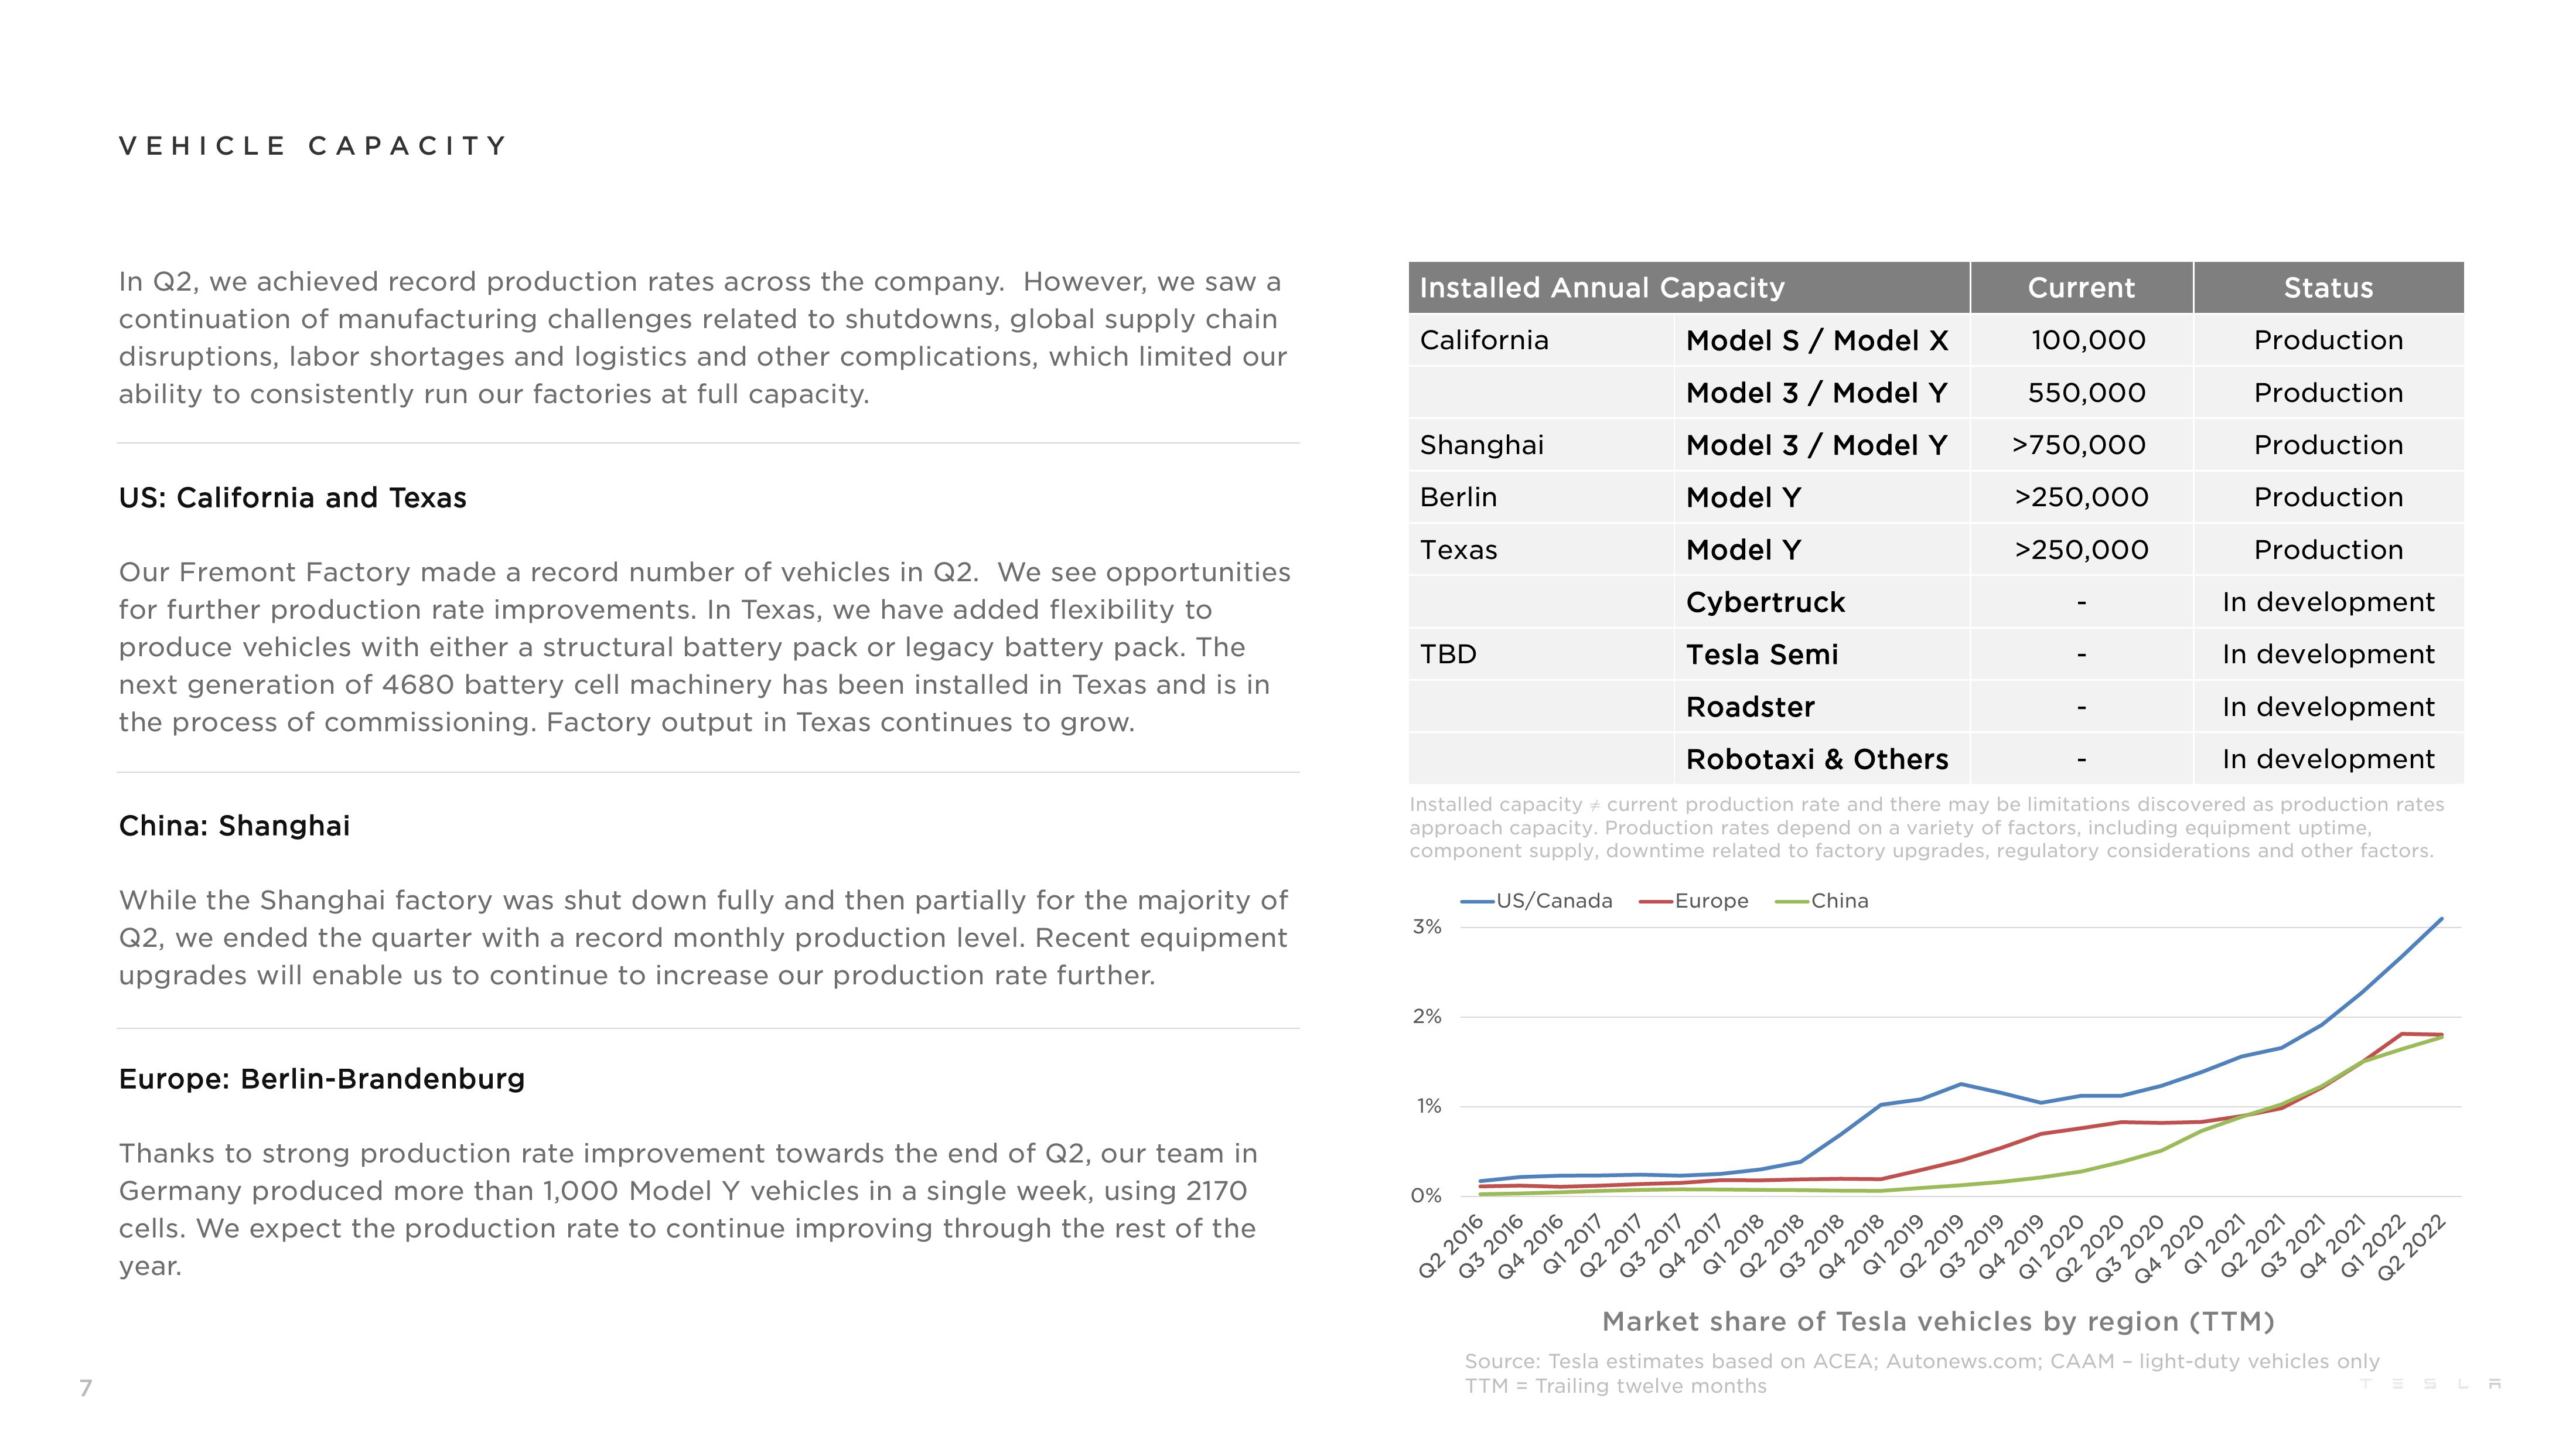
Installed Annual Capacity
California
Status
Production
Model S / Model X
Model 3 / Model Y
Production
Production
Production
Model 3 / Model Y
Model Y
Model Y
Cybertruck
Production
In development
In development
Tesla Semi
Roadster
In development
In development
Robotaxi & Others
Installed capacity current production rate and there may be limitations discovered as production rates
approach capacity. Production rates depend on a variety of factors, including equipment uptime,
component supply, downtime related to factory upgrades, regulatory considerations and other factors.
-US/Canada -Europe -China
Shanghai
Berlin
Texas
TBD
3%
2%
1%
0%
Q2 2016
Q3 2016
Q4 2016
Q1 2017
Q2 2017
Q3 2017
Q4 2017
Q1 2018
Q2 2018
Q4 2018
Q3 2018
Q1 2019
Current
100,000
550,000
>750,000
>250,000
>250,000
Q2 2019
Q3 2019
Q4 2019
Q1 2020
Q2 2020
Q3 2020
Q4 2020
Q1 2021
Q2 2021
Q3 2021
Q4 2021
Q1 2022
Q2 2022
region
(TTM)
Market share of Tesla vehicles by
Tesla estimates based on ACEA; Autonews.com; CAAM - light-duty vehicles only
TTM = Trailing twelve months
Source:
SLAView entire presentation