Freeport Copper Financials
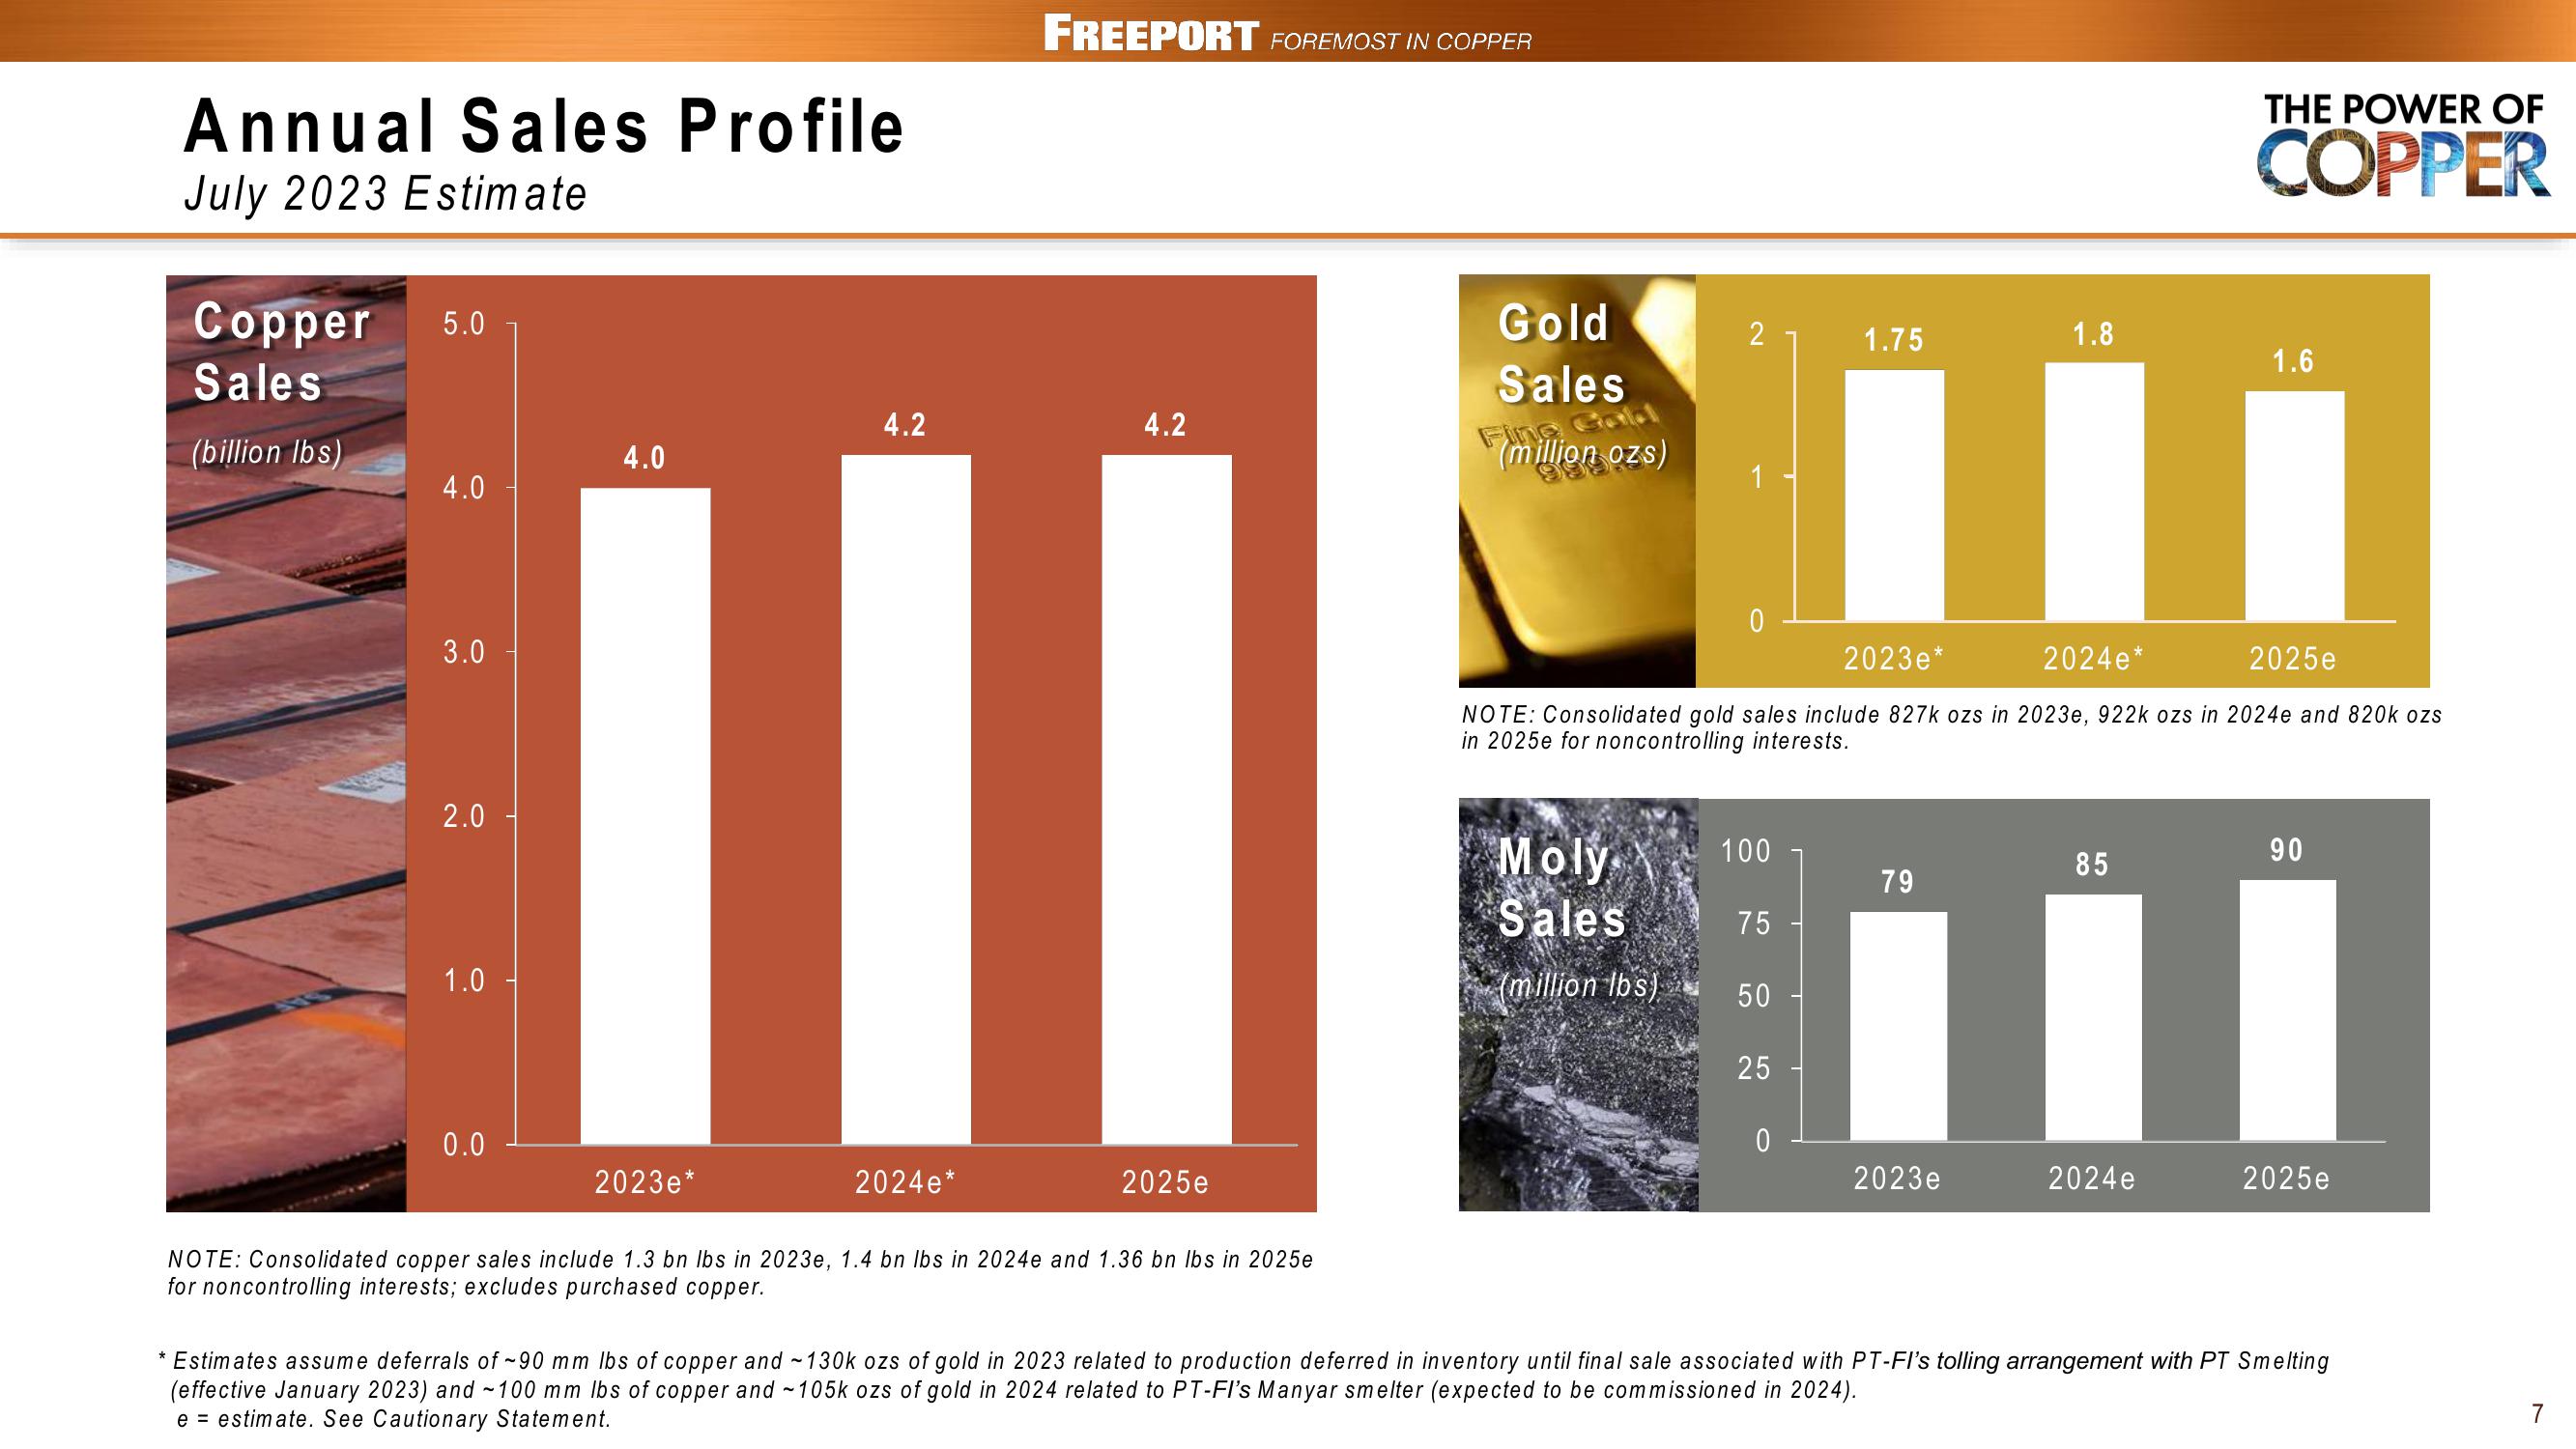
Annual Sales Profile
July 2023 Estimate
Copper 5.0
Sales
(billion lbs)
4.0
3.0
2.0
1.0
0.0
4.0
2023e*
4.2
2024e*
FREEPORT FOREMOST IN COPPER
4.2
2025e
NOTE: Consolidated copper sales include 1.3 bn lbs in 2023e, 1.4 bn lbs in 2024e and 1.36 bn lbs in 2025e
for noncontrolling interests; excludes purchased copper.
Gold
Sales
(million ozs)
2
Moly
Sales
(million lbs)
1
0
100
75
2023e*
2024e*
2025e
NOTE: Consolidated gold sales include 827k ozs in 2023e, 922k ozs in 2024e and 820k ozs
in 2025e for noncontrolling interests.
50
25
1.75
0
1.8
79
THE POWER OF
COPPER
2023e
1.6
85
III
2024e
90
2025e
* Estimates assume deferrals of ~90 mm lbs of copper and ~130k ozs of gold in 2023 related to production deferred in inventory until final sale associated with PT-FI's tolling arrangement with PT Smelting
(effective January 2023) and ~100 mm lbs of copper and ~105k ozs of gold in 2024 related to PT-FI's Manyar smelter (expected to be commissioned in 2024).
e = estimate. See Cautionary Statement.
7View entire presentation