Credit Suisse Investment Banking Pitch Book
CONFIDENTIAL
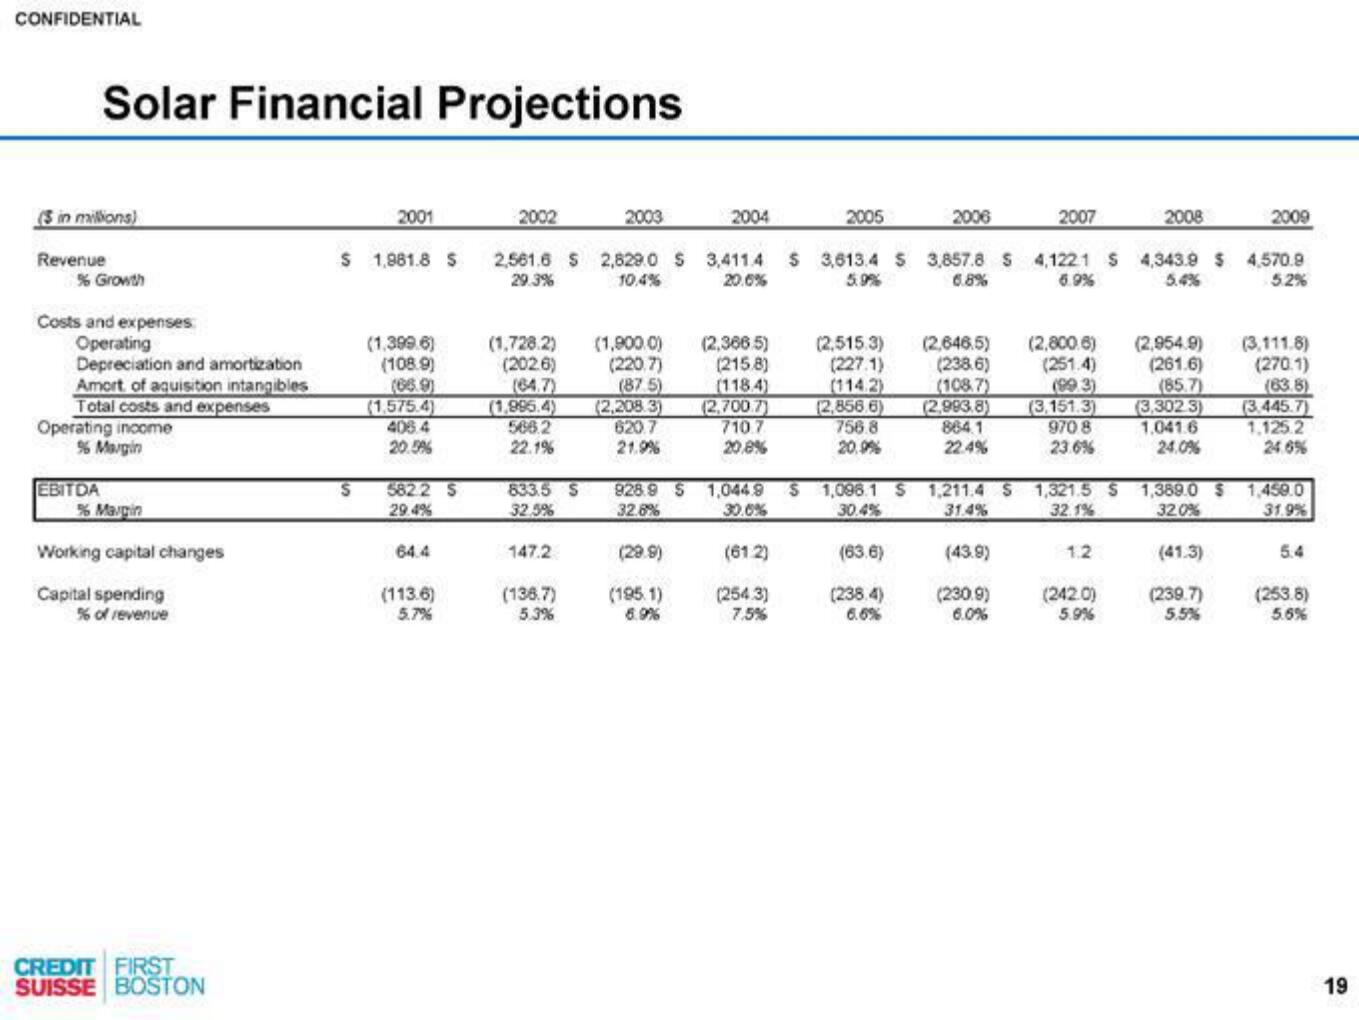
Solar Financial Projections
(3 in millions)
Revenue
% Growth
Costs and expenses:
Operating
Depreciation and amortization
Amort of aquisition intangibles
Total costs and expenses
Operating income
% Margin
EBITDA
% Margin
Working capital changes
Capital spending
% of revenue
CREDIT FIRST
SUISSE BOSTON
2001
$ 1,981.8 S
S
(1.399.6)
(108.9)
(1.575.4)
406.4
20.5%
5822 S
29.4%
64.4
(113.6)
5.7%
2009
2,561.6 $ 2,829.0 S 3,411.4 $ 3,613.4 $ 3,857.8 S 4,1221 S 4,343.9 $ 4,570.9
29.3%
20.6%
5.9%
10,4%
6.8%
5.4%
5.2%
2002
(1,728.2) (1,900.0)
(202.6)
(220,7)
(64.7)
(87.5)
(1,995.4)
566.2
22.1%
833.5 S
32.5%
147.2
2003
(138.7)
5.3%
(2,208.3)
620.7
21.9%
928.9 S
32.8%
(29.9)
(195.1)
6.9%
2004
(2,366.5)
(2158)
(118.4)
(2,700.7)
710.7
20.8%
1,044.9
30.0%
(61.2)
(254.3)
7.5%
2005
(2,515.3)
(227.1)
(114.2)
(2,856.6)
756.8
20.9%
S 1,098.1 S
30.4%
(63.6)
(238.4)
6.6%
2006
(2,646.5)
(238.6)
(108.7)
864.1
22.4%
2007
(2,993.8) (3.151.3)
970 8
23.6%
(2,800.6)
(251.4)
(99.3)
(43.9)
(230.9)
6.0%
1.2
2008
(242.0)
5.9%
(2,954.9)
(261.6)
(85.7)
(3,302.3)
1.041.6
24.0%
1,211.4 S 1,321.5 S 1,389.0 $ 1,450.0
31.4%
32.0%
32.1%
31.9%
(3,111.8)
(270.1)
(63.8)
(41.3)
(239.7)
5.5%
(3.445.7)
1.125.2
24.6%
5.4
(253.8)
5.6%
19View entire presentation