Evercore Investment Banking Pitch Book
Preliminary Financial Analysis
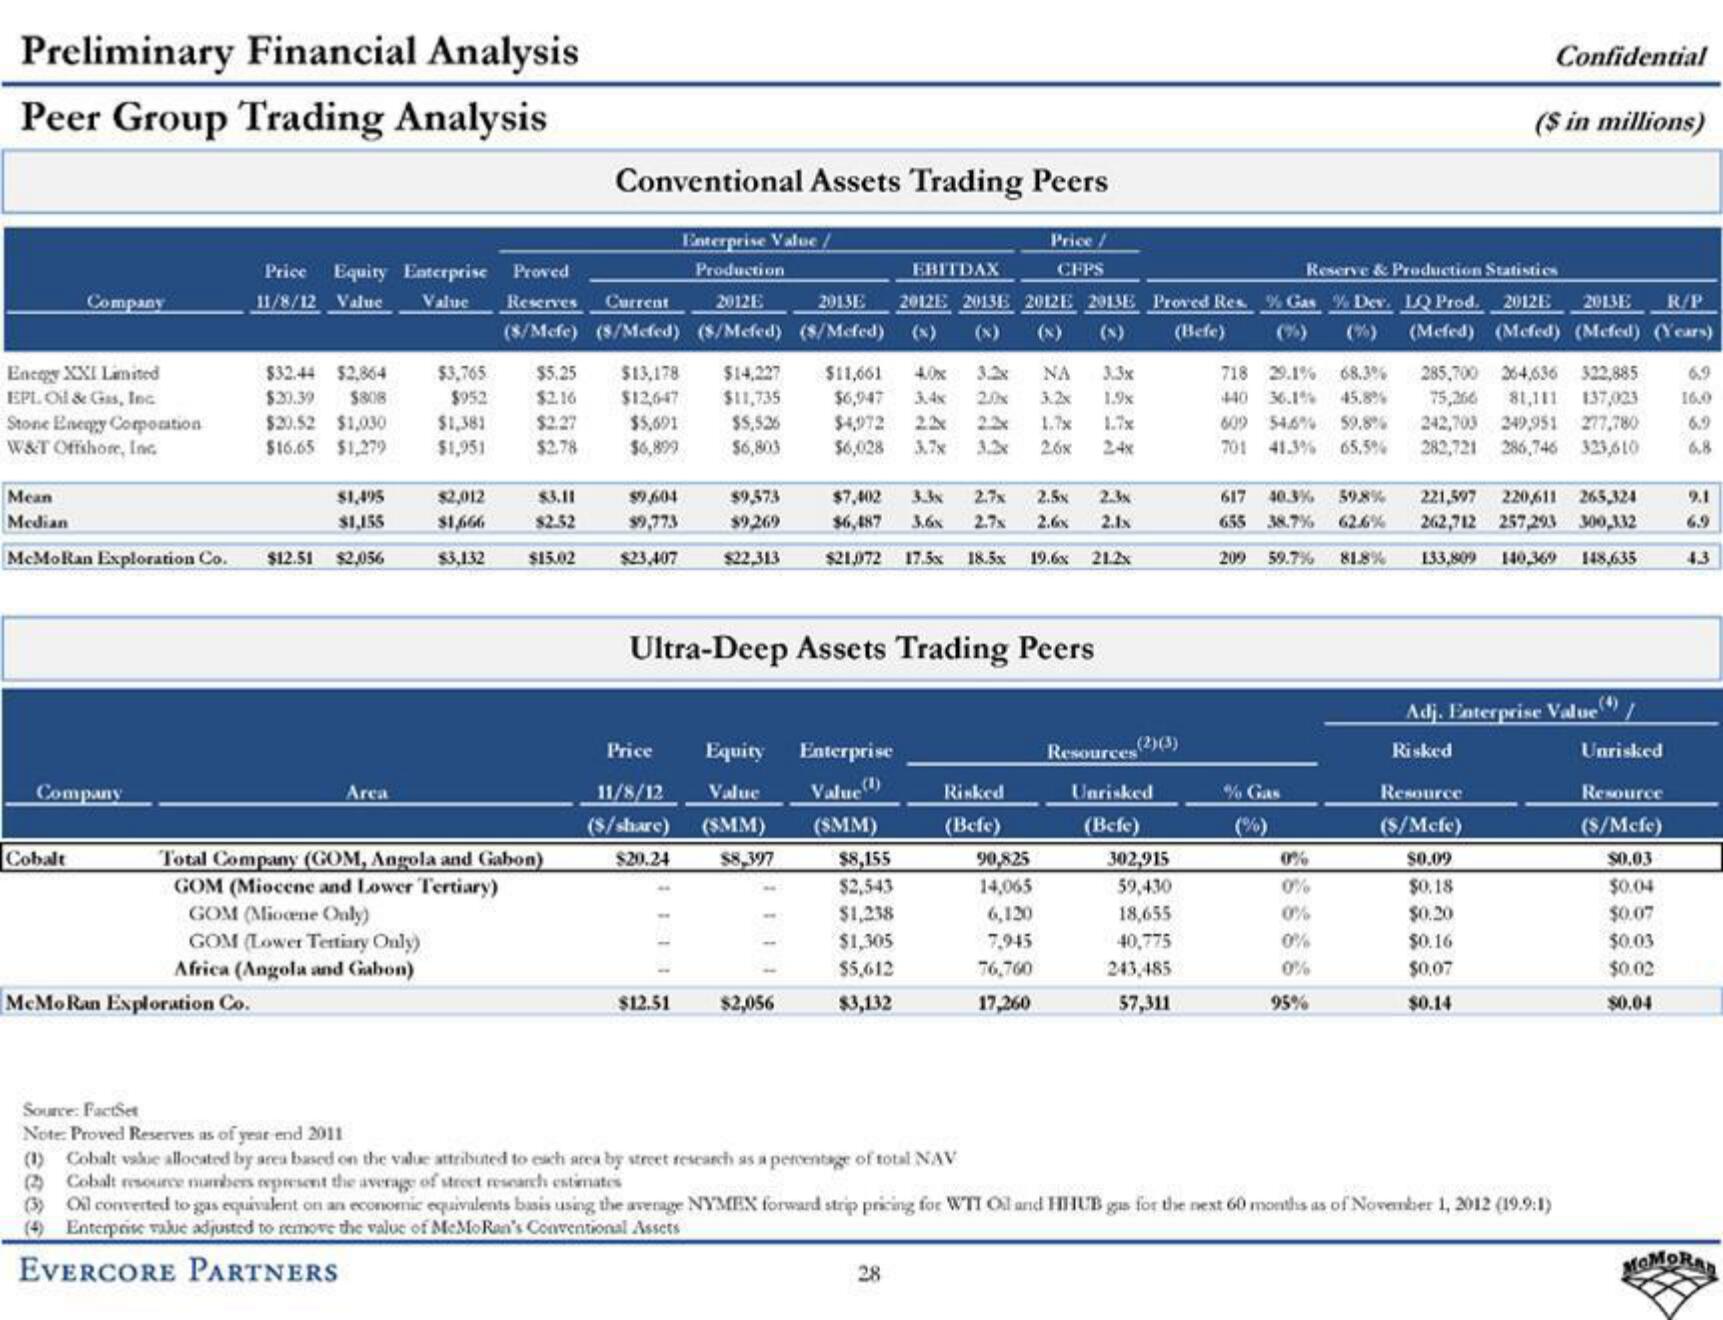
Peer Group Trading Analysis
Company
Encegy XXI Limited
EPL Oil & Gas, Inc.
Stone Energy Corporation
W&T Offshore, Inc.
Mean
Median
McMoRan Exploration Co.
Company
Cobalt
McMo Ran Exploration Co.
$32.44 $2,864
$20.39 $808
$20.52 $1,030
$16.65 $1,279
Price Equity Enterprise Proved
11/8/12 Value Value Reserves Current
$1,495
$1,155
$12.51 $2,056
Area
$3,765
$952
$1,381
$1,951
Enterprise Value
Production
2012E
2013E
(8/Mefe) (8/Mefed) (S/Mefed) (S/Mefed)
Conventional Assets Trading Peers
Price /
CFPS
$5.25 $13,178 $14,227
$2.16 $12,647 $11,735
$2.27
$5,526
$5,691
$2.78
$6,899
$6,803
$2,012
$3.11
31,666 $2.52
$3,132 $15.02
Total Company (GOM, Angola and Gabon)
GOM (Miocene and Lower Tertiary)
GOM (Miocene Only)
GOM (Lower Tertiary Only)
Africa (Angola and Gabon)
$9,604
$9,773
$23,407
Price
$9,573
$9,269
$22,313
$12.51
11/8/12 Value
($/share)
(SMM)
$20.24
Ultra-Deep Assets Trading Peers
Equity Enterprise
Value (1)
(SMM)
$8,397
$2,056
$11,661
NA
$6,947 3.4x 20x 3.2x 1.9x
$4,972
22x 1.7x
$6,028 3.7x
2.6x
EBITDAX
2.7x 2.50x
$7,402
$6,487 3.6x 2.7% 2.60% 2.1x
$21072 175x185x 19.6x 21.2x
$8,155
$2,543
$1,238
$1,305
$5,612
$3,132
(Befe)
Reserve & Production Statistics
2012E 2013E 2012E 2013E Proved Res. % Gas % Dev. LQ Prod.
2012E 2013E R/P
(x)
(%) (Mefed) (Mefed) (Mefed) (Years)
718 29.1% 68.3% 285,700 264,636 322,885 6.9
440 36.1% 45.8% 75,266 81,111 137,023 16.0
609 54.6% 59.8% 242,703 249,951 277,780 6.9
701 41.3% 65,5% 282,721 286,746 323,610 6.8
28
Risked
(Befe)
90,825
14,065
6,120
24x
7,945
76,760
17,260
(2) (3)
Resources
Unrisked
(Befe)
302,915
59,430
18,655
40,775
243,485
57,311
617 40.3% 59,8%
655
38,7%
209 59.7%
% Gas
0%
0%
0%
0%
95%
81.8%
Confidential
($ in millions)
221,597 220,611 265,324
262,712 257,293 300,332
133,809 140,369 148,635
Resource
(S/Mcfe)
$0.09
$0.18
$0.20
$0.16
$0.07
$0.14
Adj. Enterprise Value()
Risked
Source: FactSet
Note: Proved Reserves as of year end 2011
(1) Cobalt value allocated by area based on the value attributed to each area by street research as a percentage of total NAV
(2) Cobalt resource numbers represent the average of street research estimates
(3) Oil converted to gas equivalent on an economic equivalents basis using the average NYMEX forward strip pricing for WTI Oil and HHUB gas for the next 60 months as of November 1, 2012 (19.9:1)
(4) Enterprise value adjusted to remove the value of MeMo Ran's Conventional Assets
EVERCORE PARTNERS
Unrisked
Resource
($/Mcfe)
$0,03
$0.04
$0.07
$0.03
$0.02
$0.04
9.1
6.9
MOMORADView entire presentation