Yelp Results Presentation Deck
U.S. Cohort
2005 - 2006
Cohort
2007 - 2008
Cohort
2009 - 2010
Cohort
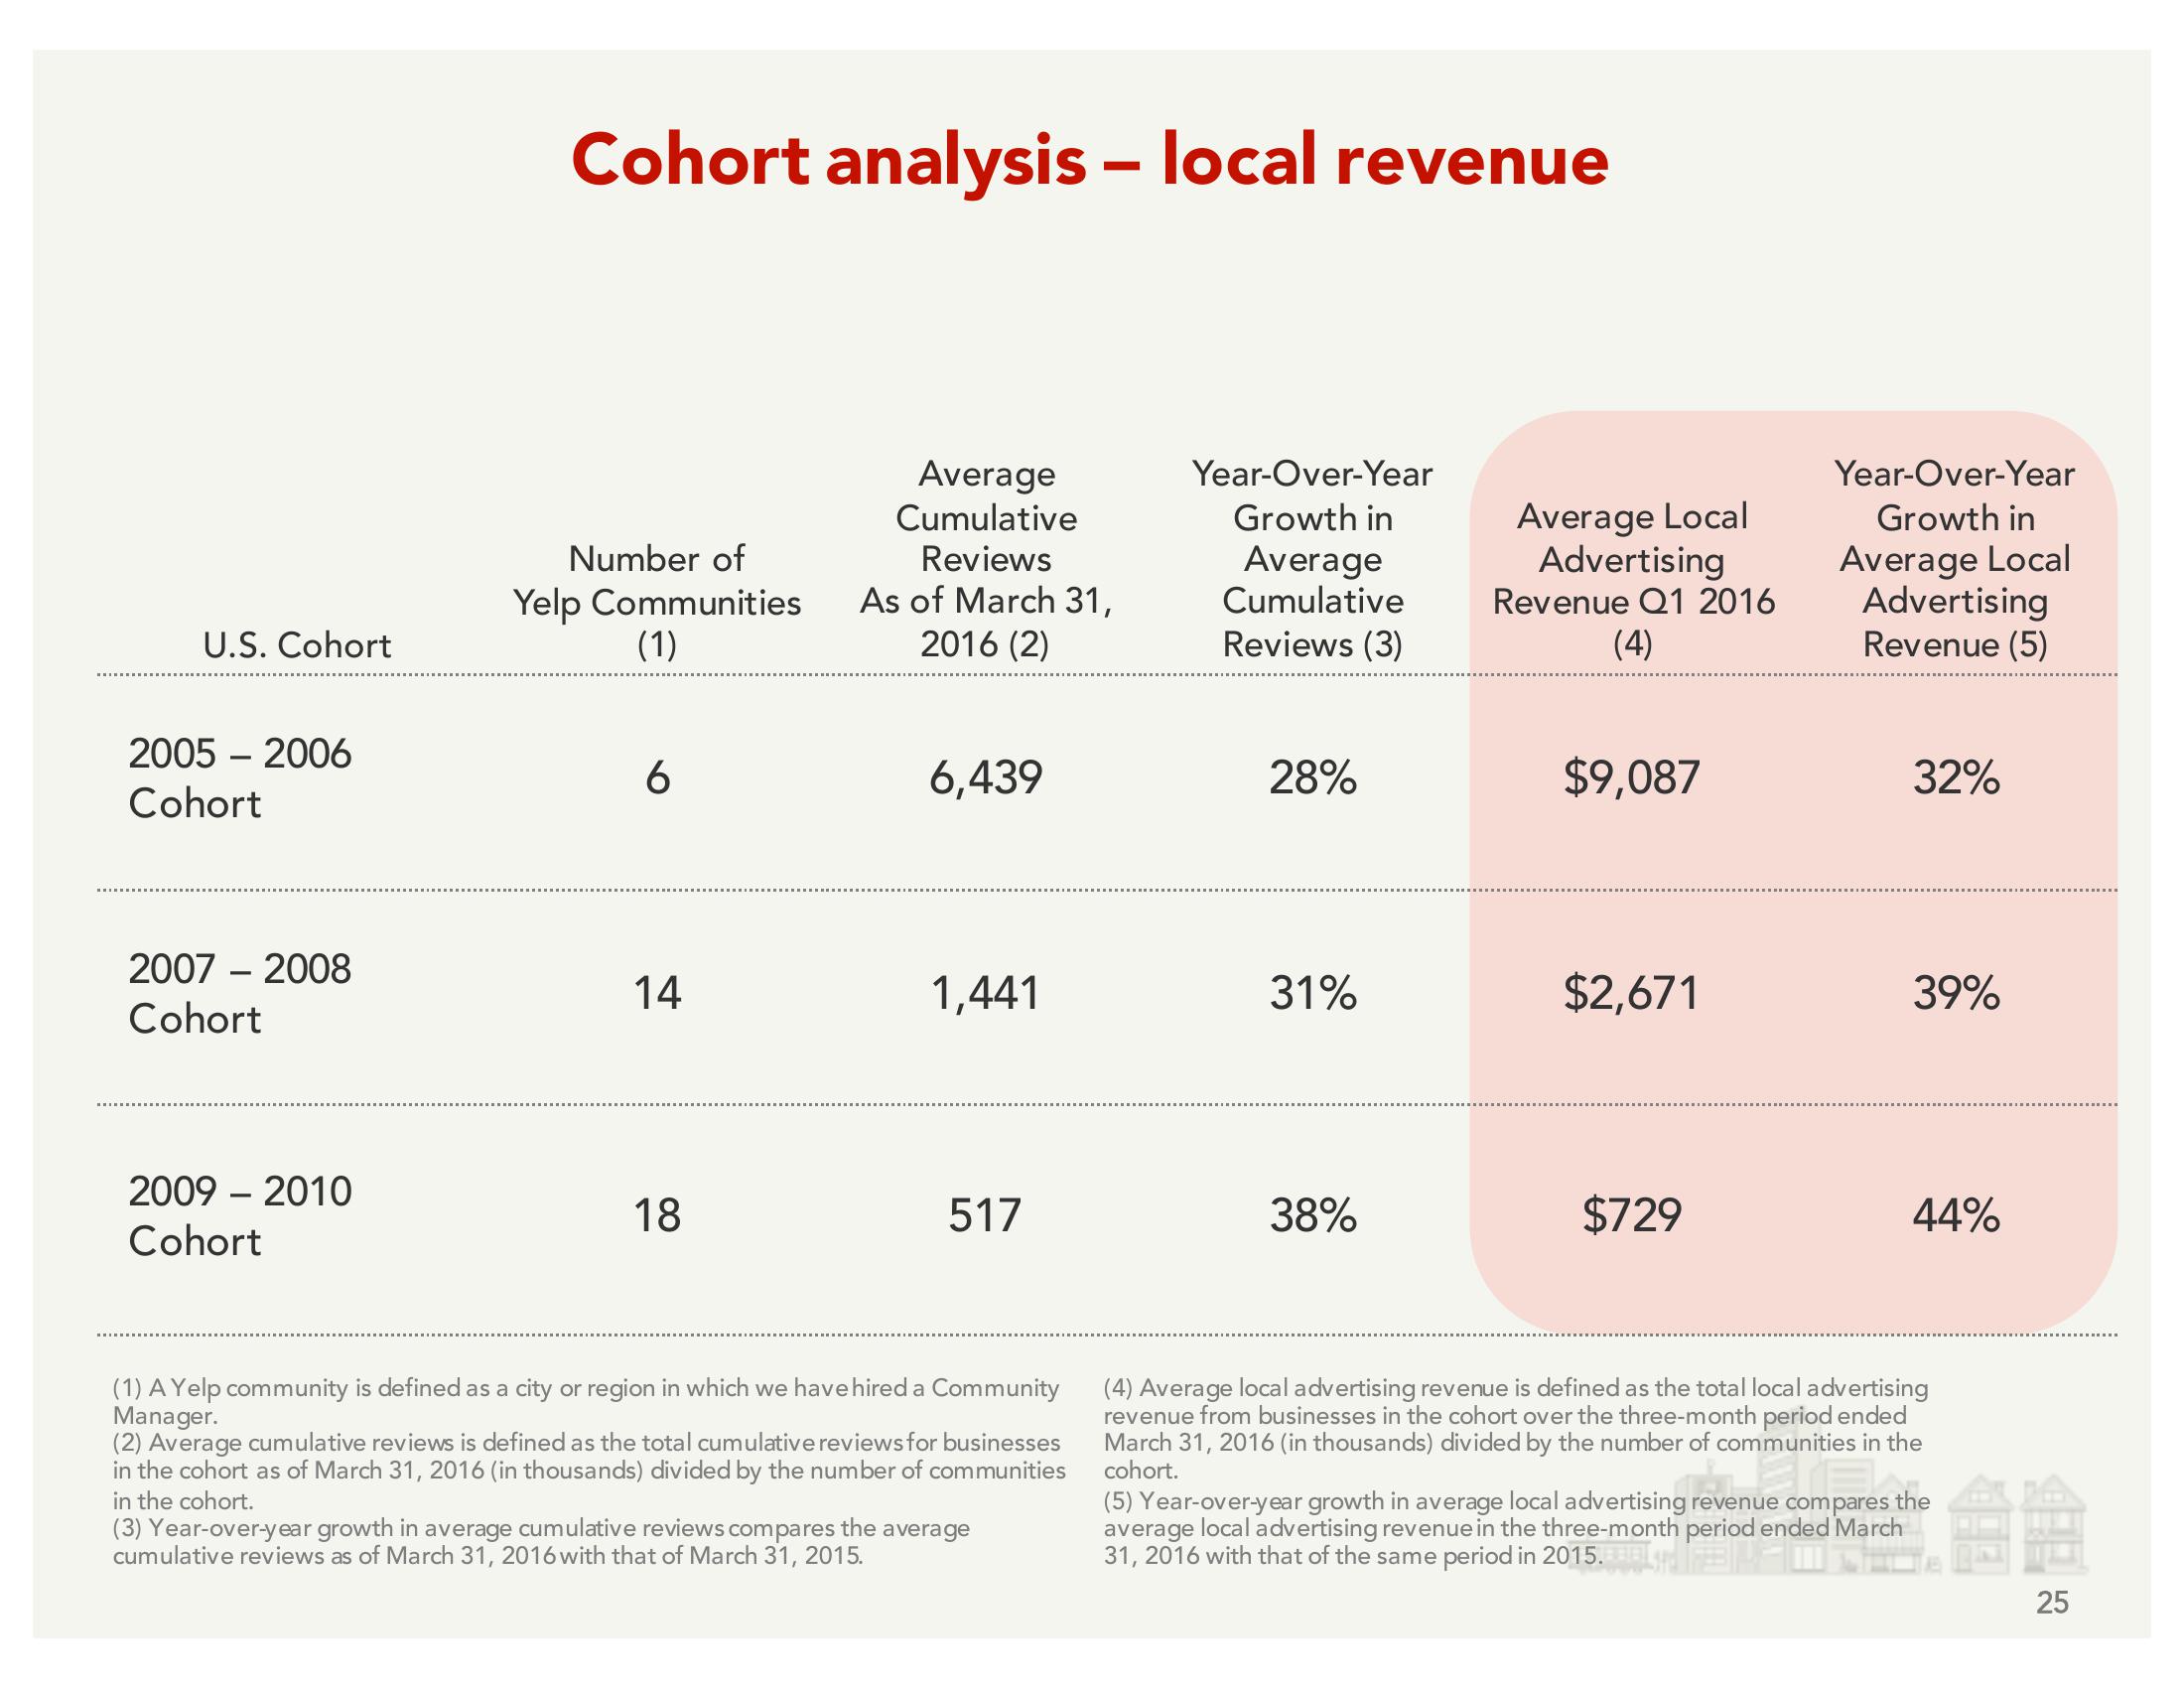
Cohort analysis - local revenue
Number of
Yelp Communities
(1)
6
14
18
Average
Cumulative
Reviews
As of March 31,
2016 (2)
6,439
1,441
517
(1) A Yelp community is defined as a city or region in which we have hired a Community
Manager.
(2) Average cumulative reviews is defined as the total cumulative reviews for businesses
in the cohort as of March 31, 2016 (in thousands) divided by the number of communities
in the cohort.
(3) Year-over-year growth in average cumulative reviews compares the average
cumulative reviews as of March 31, 2016 with that of March 31, 2015.
Year-Over-Year
Growth in
Average
Cumulative
Reviews (3)
28%
31%
38%
Average Local
Advertising
Revenue Q1 2016
(4)
$9,087
$2,671
$729
Year-Over-Year
Growth in
Average Local
Advertising
Revenue (5)
32%
39%
44%
(4) Average local advertising revenue is defined as the total local advertising
revenue from businesses in the cohort over the three-month period ended
March 31, 2016 (in thousands) divided by the number of communities in the
cohort.
(5) Year-over-year growth in average local advertising revenue compares the
average local advertising revenue in the three-month period ended March
31, 2016 with that of the same period in 2015.
25View entire presentation