Cboe Results Presentation Deck
Non-GAAP Information
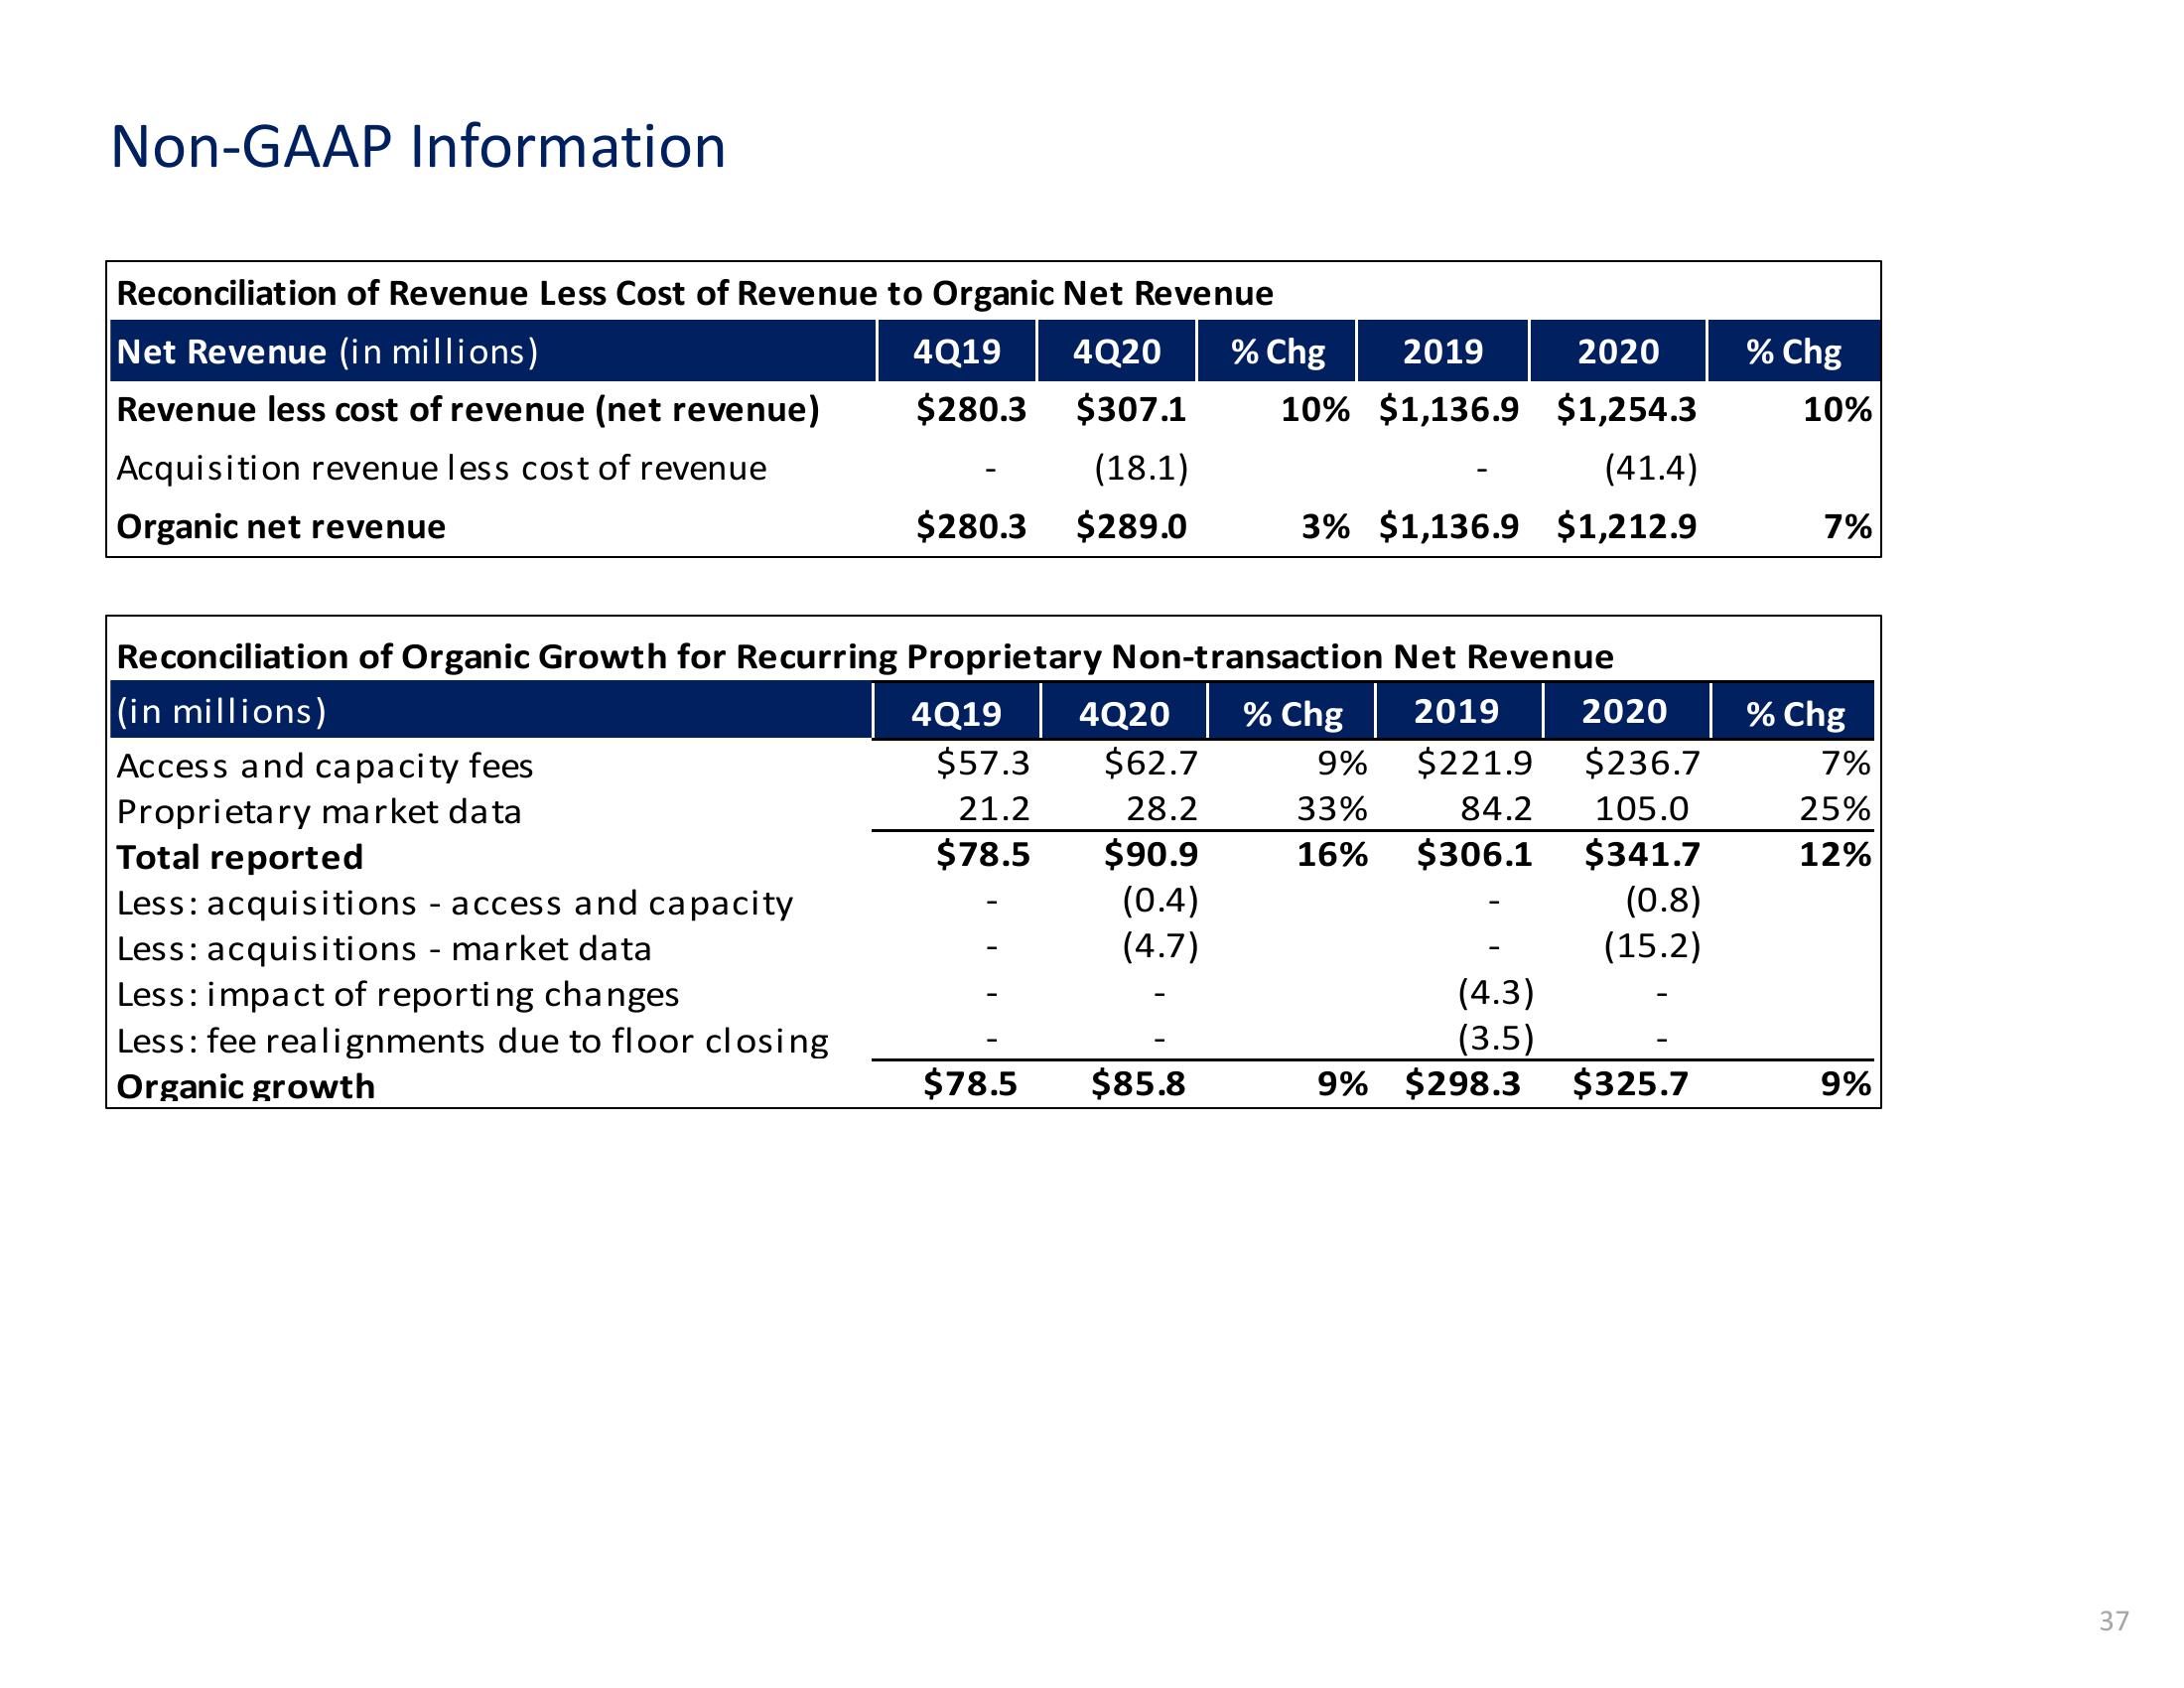
Reconciliation of Revenue Less Cost of Revenue to Organic Net Revenue
Net Revenue (in millions)
4Q19 4Q20 % Chg
$280.3 $307.1
(18.1)
Revenue less cost of revenue (net revenue)
Acquisition revenue less cost of revenue
Organic net revenue
$280.3 $289.0
Access and capacity fees
Proprietary market data
Reconciliation of Organic Growth for Recurring Proprietary Non-transaction Net Revenue
(in millions)
4Q19 4Q20 % Chg
$57.3
$62.7
21.2
28.2
$78.5 $90.9
(0.4)
(4.7)
Total reported
Less: acquisitions - access and capacity
Less: acquisitions - market data
Less: impact of reporting changes
Less: fee realignments due to floor closing
Organic growth
2019 2020
10% $1,136.9 $1,254.3
$78.5 $85.8
(41.4)
3% $1,136.9 $1,212.9
2019
$221.9
84.2
9%
33%
16% $306.1
2020
$236.7
105.0
$341.7
(0.8)
(15.2)
(4.3)
(3.5)
9% $298.3 $325.7
% Chg
10%
7%
% Chg
7%
25%
12%
9%
37View entire presentation