Paysafe Results Presentation Deck
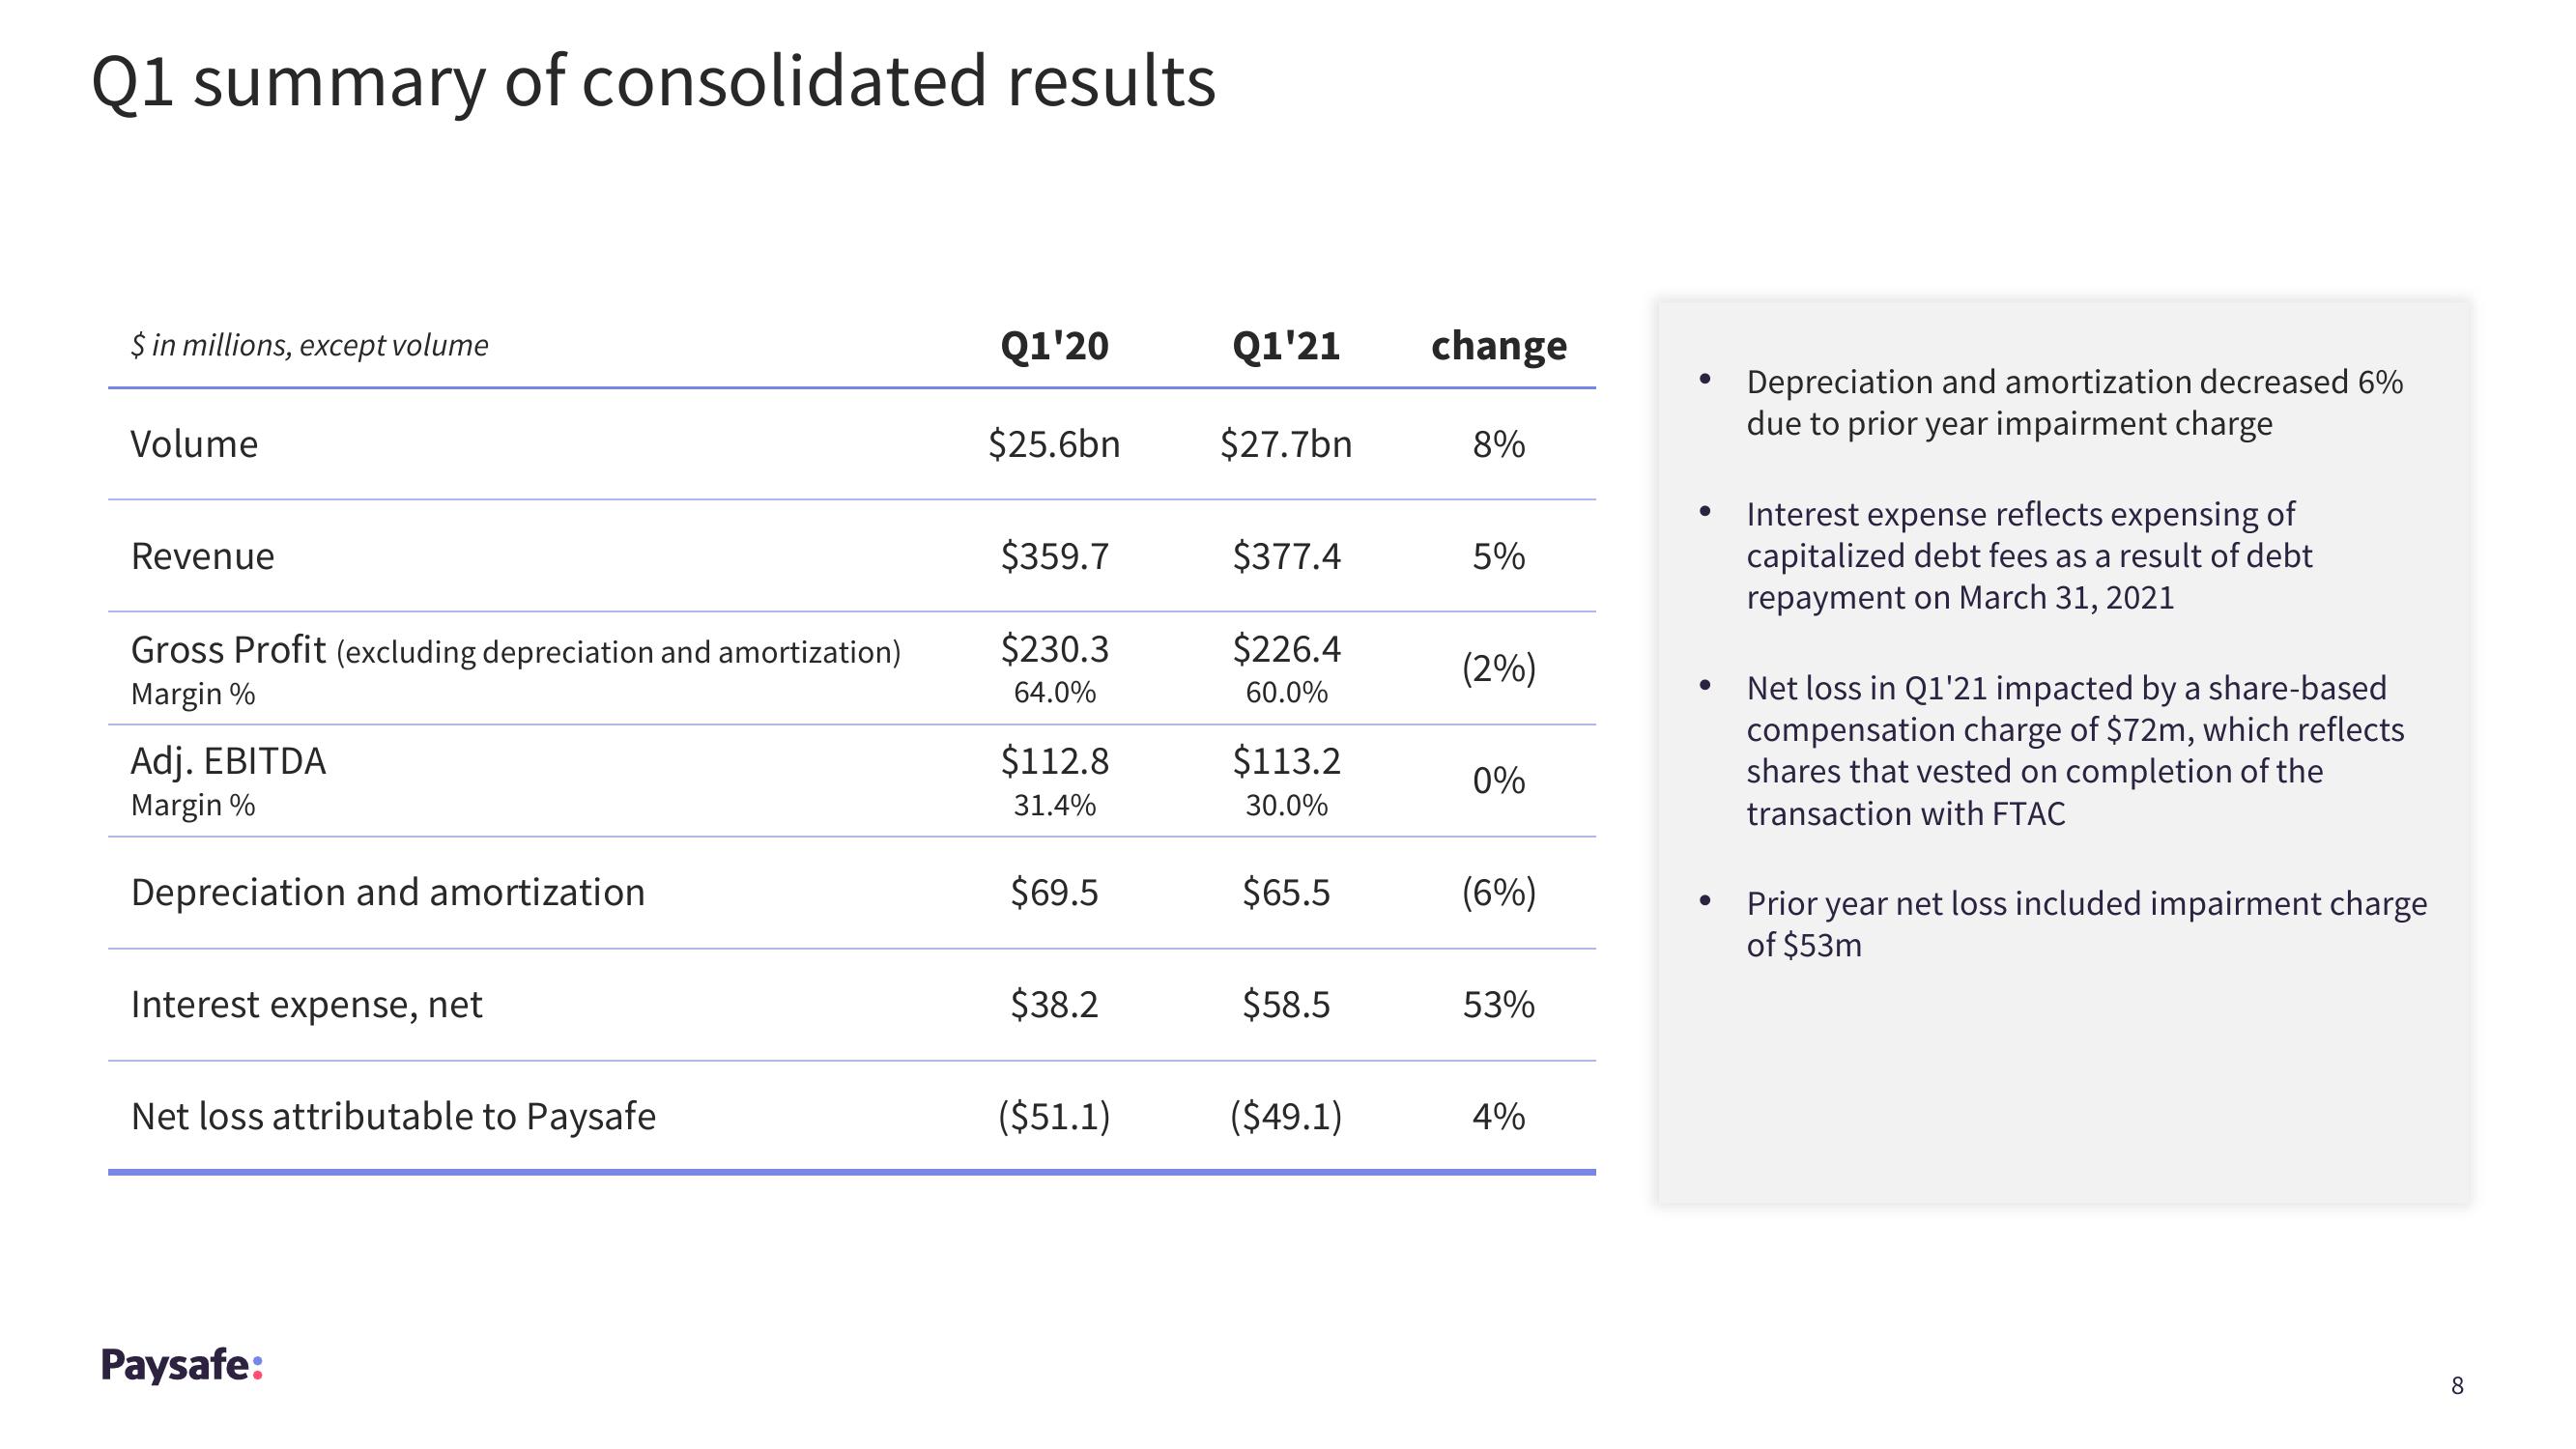
Q1 summary of consolidated results
$ in millions, except volume
Volume
Revenue
Gross Profit (excluding depreciation and amortization)
Margin %
Adj. EBITDA
Margin %
Depreciation and amortization
Interest expense, net
Net loss attributable to Paysafe
Paysafe:
Q1'20
$25.6bn
$359.7
$230.3
64.0%
$112.8
31.4%
$69.5
$38.2
($51.1)
Q1'21
$27.7bn
$377.4
$226.4
60.0%
$113.2
30.0%
$65.5
$58.5
($49.1)
change
8%
5%
(2%)
0%
(6%)
53%
4%
●
●
●
Depreciation and amortization decreased 6%
due to prior year impairment charge
Interest expense reflects expensing of
capitalized debt fees as a result of debt
repayment on March 31, 2021
Net loss in Q1'21 impacted by a share-based
compensation charge of $72m, which reflects
shares that vested on completion of the
transaction with FTAC
Prior year net loss included impairment charge
of $53m
8View entire presentation