Bank of America Results Presentation Deck
3Q22 Highlights
(Comparisons to 3Q21, unless otherwise noted)
.
●
.
·
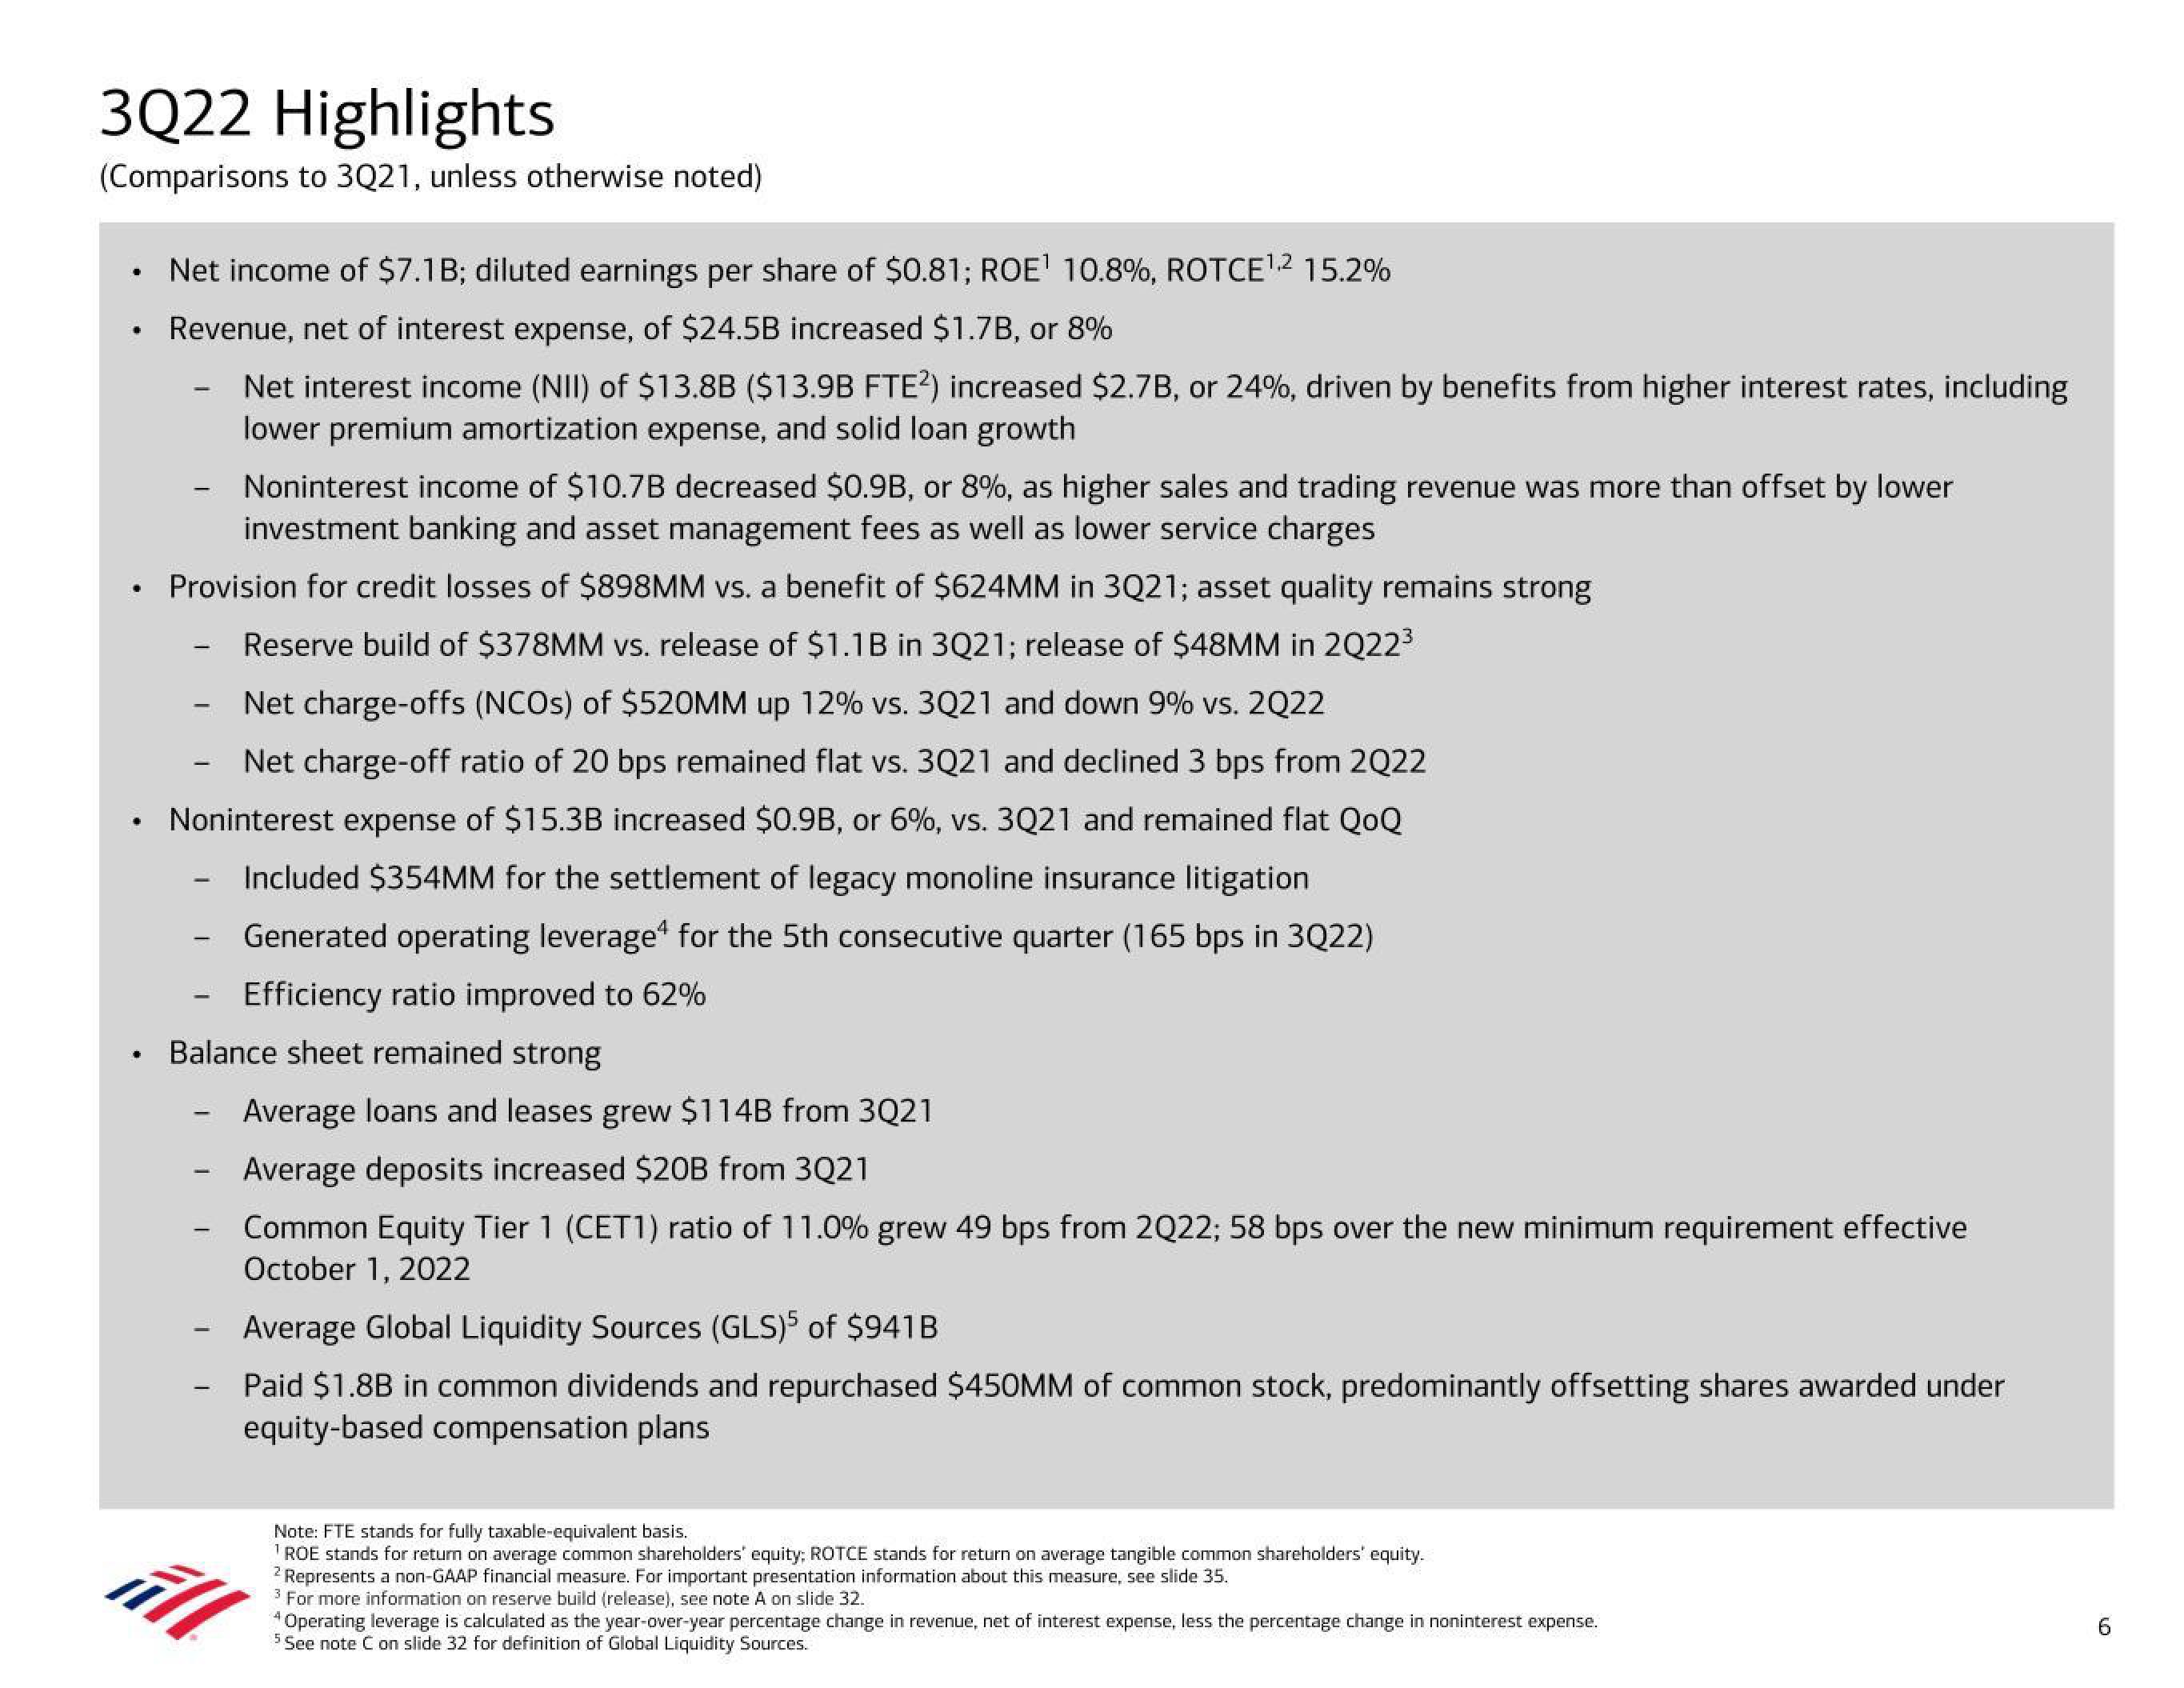
Net income of $7.1B; diluted earnings per share of $0.81; ROE¹ 10.8%, ROTCE¹.² 15.2%
Revenue, net of interest expense, of $24.5B increased $1.7B, or 8%
Net interest income (NII) of $13.8B ($13.9B FTE2) increased $2.7B, or 24%, driven by benefits from higher interest rates, including
lower premium amortization expense, and solid loan growth
Noninterest income of $10.7B decreased $0.9B, or 8%, as higher sales and trading revenue was more than offset by lower
investment banking and asset management fees as well as lower service charges
Provision for credit losses of $898MM vs. a benefit of $624MM in 3Q21; asset quality remains strong
Reserve build of $378MM vs. release of $1.1B in 3Q21; release of $48MM in 2Q22³
Net charge-offs (NCOs) of $520MM up 12% vs. 3Q21 and down 9% vs. 2Q22
Net charge-off ratio of 20 bps remained flat vs. 3Q21 and declined 3 bps from 2Q22
Noninterest expense of $15.3B increased $0.9B, or 6%, vs. 3Q21 and remained flat QoQ
Included $354MM for the settlement of legacy monoline insurance litigation
Generated operating leverage for the 5th consecutive quarter (165 bps in 3Q22)
Efficiency ratio improved to 62%
Balance sheet remained strong
-
Average loans and leases grew $114B from 3Q21
- Average deposits increased $20B from 3Q21
Common Equity Tier 1 (CET1) ratio of 11.0% grew 49 bps from 2Q22; 58 bps over the new minimum requirement effective
October 1, 2022
Average Global Liquidity Sources (GLS)5 of $941B
Paid $1.8B in common dividends and repurchased $450MM of common stock, predominantly offsetting shares awarded under
equity-based compensation plans
ill
Note: FTE stands for fully taxable-equivalent basis.
¹ROE stands for return on average common shareholders' equity; ROTCE stands for return on average tangible common shareholders' equity.
2 Represents a non-GAAP financial measure. For important presentation information about this measure, see slide 35.
3 For more information on reserve build (release), see note A on slide 32.
4 Operating leverage is calculated as the year-over-year percentage change in revenue, net of interest expense, less the percentage change in noninterest expense.
5 See note C on slide 32 for definition of Global Liquidity Sources.
6View entire presentation