Maersk Investor Presentation Deck
We continue to strengthen the capacity management
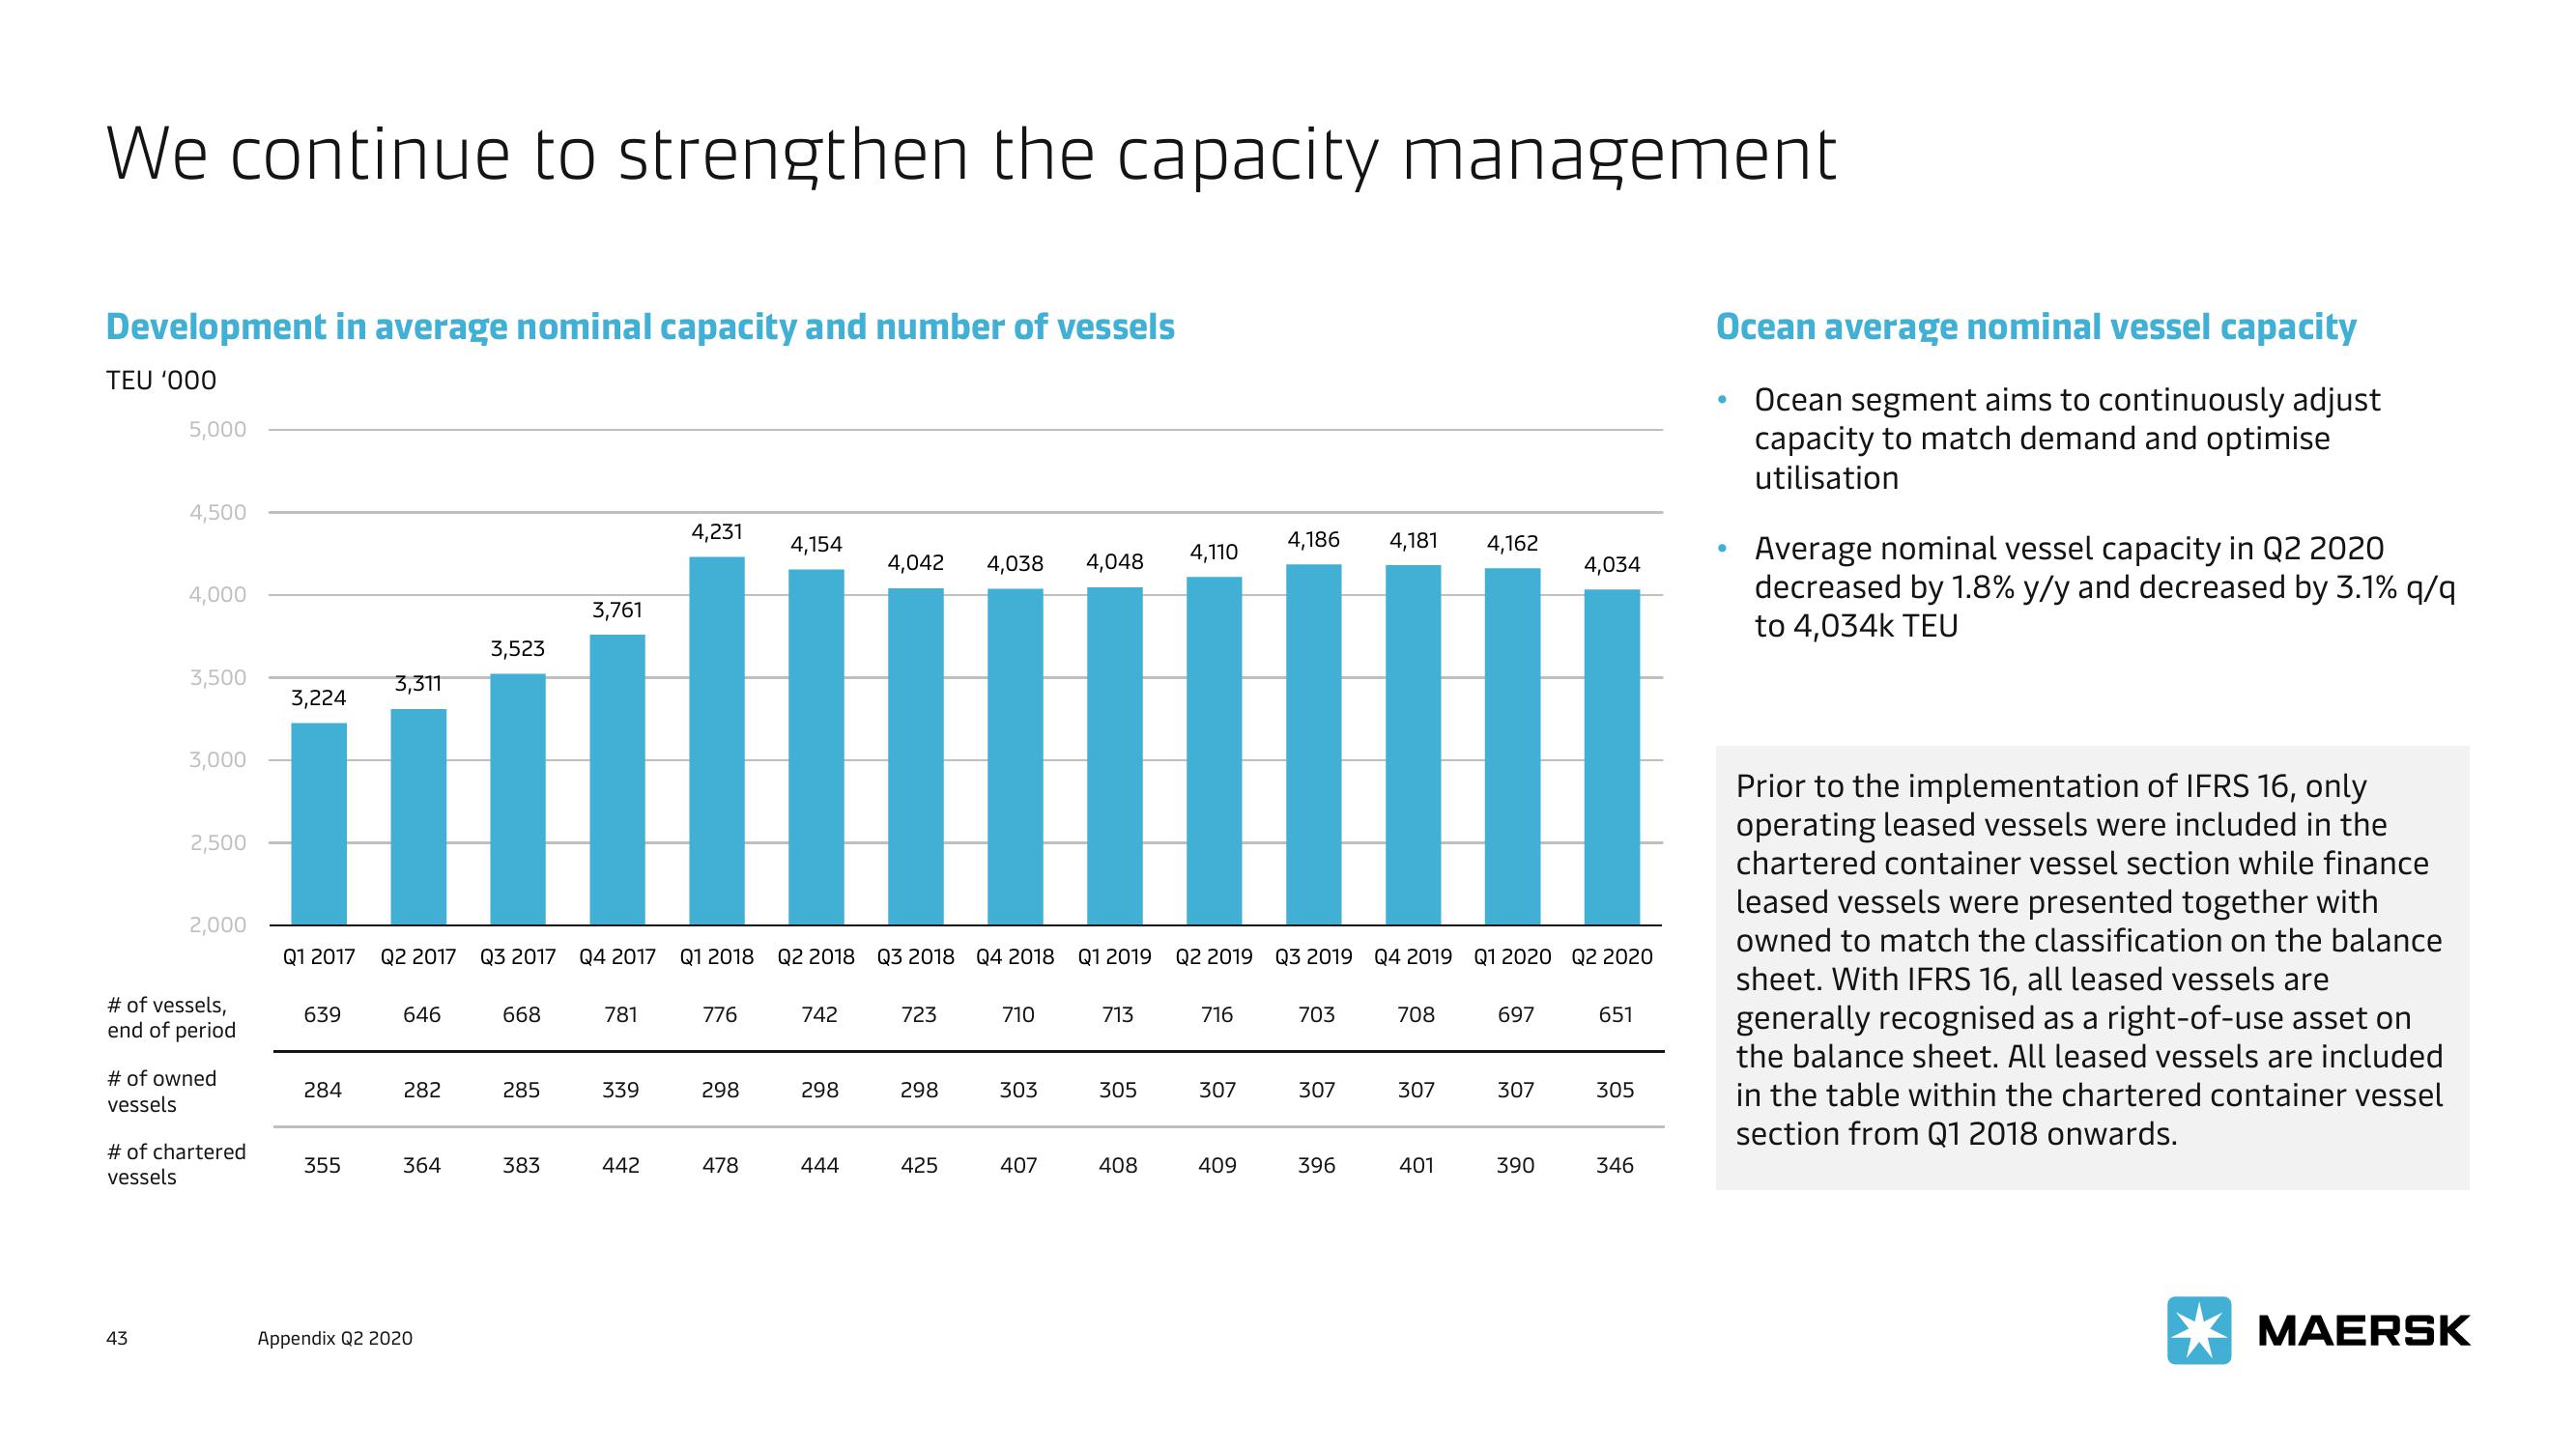
Development in average nominal capacity and number of vessels
TEU '000
5,000
4,500
4,000
43
3,500
3,000
2,500
2,000
# of vessels,
end of period
# of owned
vessels
# of chartered
vessels
3,311
3,224
il
Q1 2017 Q2 2017
639
284
355
646
282
364
Appendix Q2 2020
3,523
Q3 2017 Q4 2017
668
285
3,761
383
781
339
442
4,231
776
Q1 2018 Q2 2018 Q3 2018 Q4 2018
298
4,154
478
742
298
4,042 4,038 4,048
444
723
298
425
710
303
407
713
305
4,110
408
Q1 2019 Q2 2019 Q3 2019 Q4 2019 Q1 2020 Q2 2020
716
307
4,186
409
703
307
4,181
396
708
307
4,162
401
697
307
4,034
390
651
305
346
Ocean average nominal vessel capacity
Ocean segment aims to continuously adjust
capacity to match demand and optimise
utilisation
●
Average nominal vessel capacity in Q2 2020
decreased by 1.8% y/y and decreased by 3.1% q/q
to 4,034k TEU
Prior to the implementation of IFRS 16, only
operating leased vessels were included in the
chartered container vessel section while finance
leased vessels were presented together with
owned to match the classification on the balance
sheet. With IFRS 16, all leased vessels are
generally recognised as a right-of-use asset on
the balance sheet. All leased vessels are included
in the table within the chartered container vessel
section from Q1 2018 onwards.
MAERSKView entire presentation