Kin SPAC Presentation Deck
750
500
250
0
(250)
(500)
kin.com | 77
167
(335)
2011
Erie Exchange vs. Indemnity ($ in mm)
Erie Indemnity Co.
Operating Income
157
(197)
209
2012-.
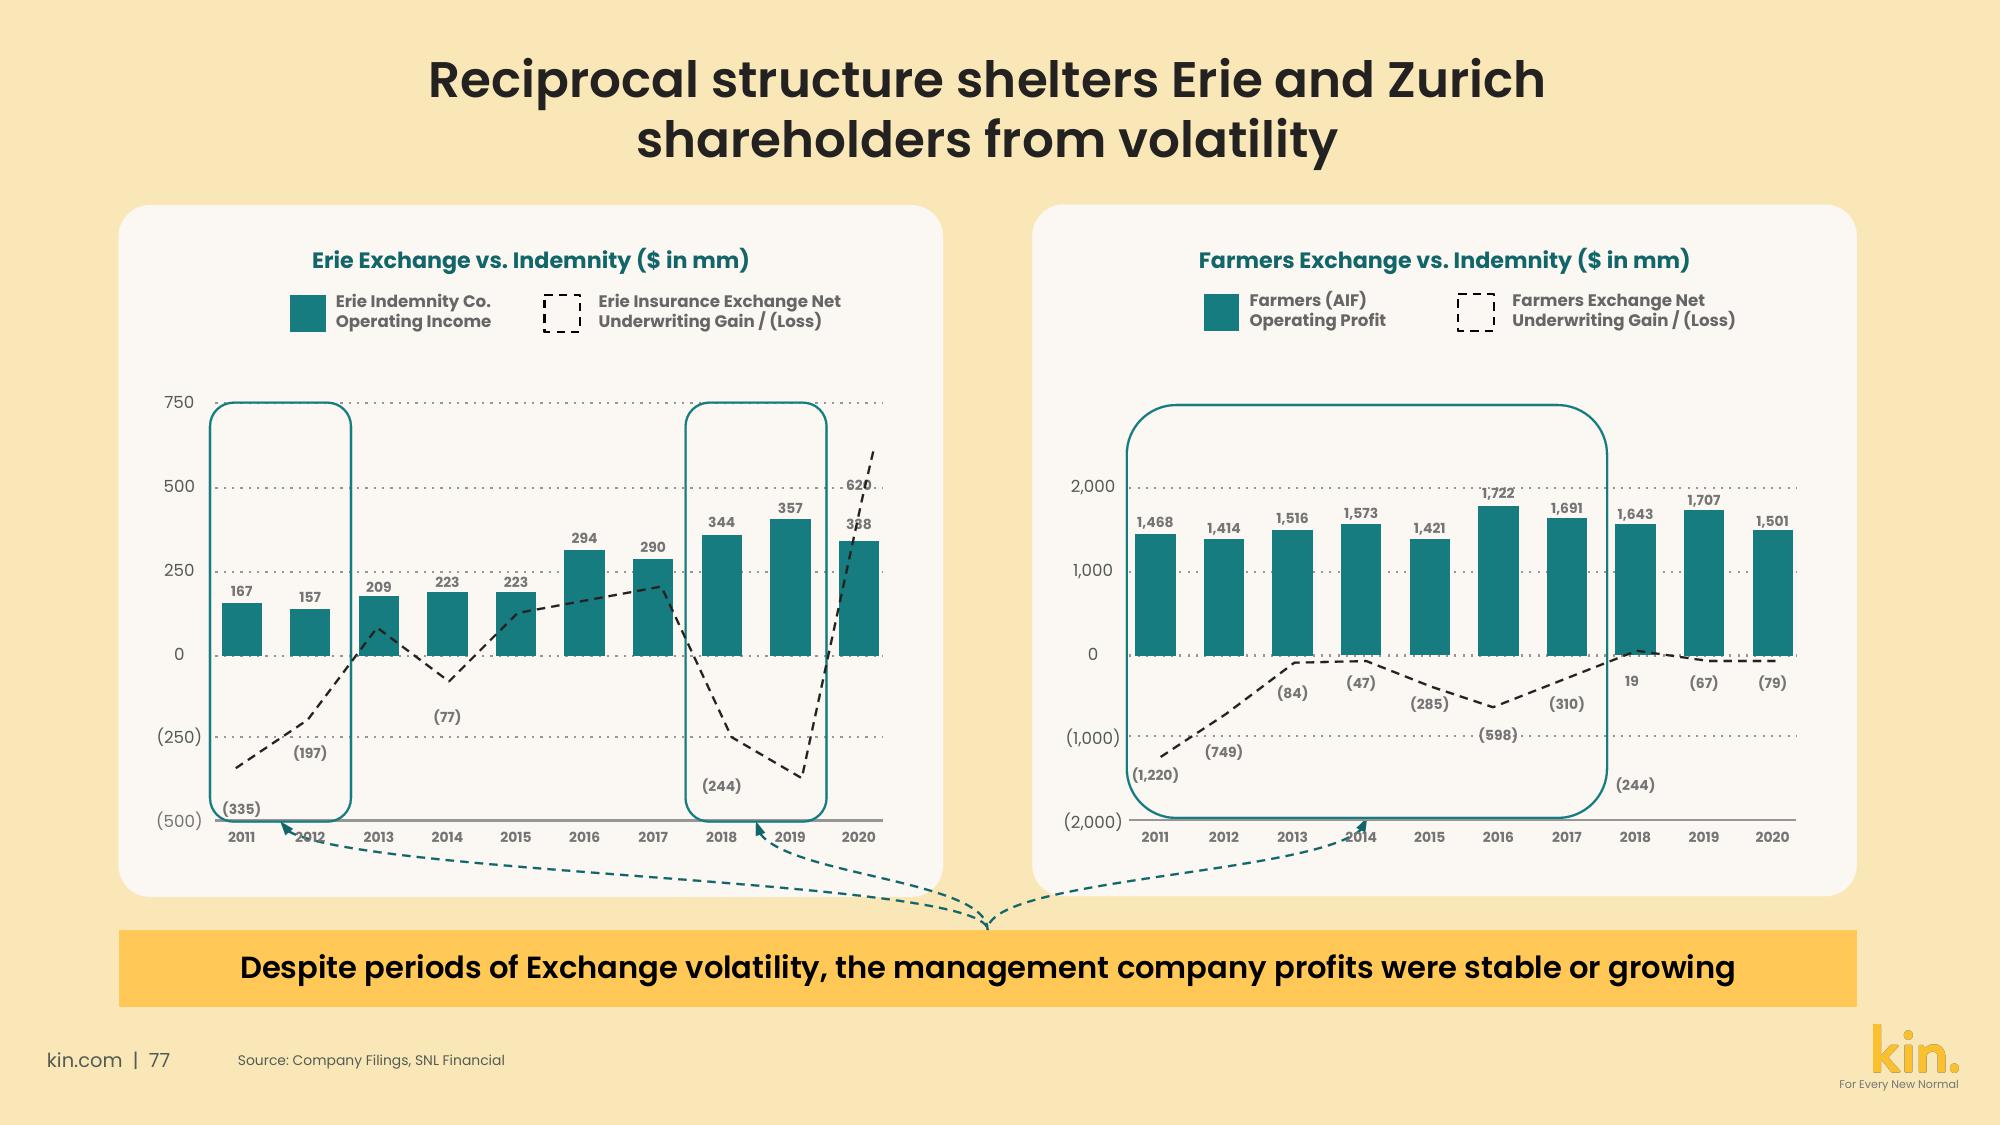
Reciprocal structure shelters Erie and Zurich
shareholders from volatility
2013
223
(77)
2014
223
2015
I
Source: Company Filings, SNL Financial
Erie Insurance Exchange Net
Underwriting Gain / (Loss)
294
2016
290
2017
620
I
388
357
344
ill
J
(244)
2019 2020
2018
2,000
1,000
0
(1,000)
(2,000)
1,468
(1,220)
2011
Farmers Exchange vs. Indemnity ($ in mm)
Farmers (AIF)
Operating Profit
0
1,414
(749)
2012
1,516
(84)
1,573
(47)
1,421
(285)
Farmers Exchange Net
Underwriting Gain / (Loss)
1,691
1,643
illu
2013 2014 2015
1,722
(598)
2016
(310)
2017
19
(244)
1,707
2018
(67) (79)
2019
Despite periods of Exchange volatility, the management company profits were stable or growing
1,501
2020
kin.
For Every New NormalView entire presentation