Inovalon Results Presentation Deck
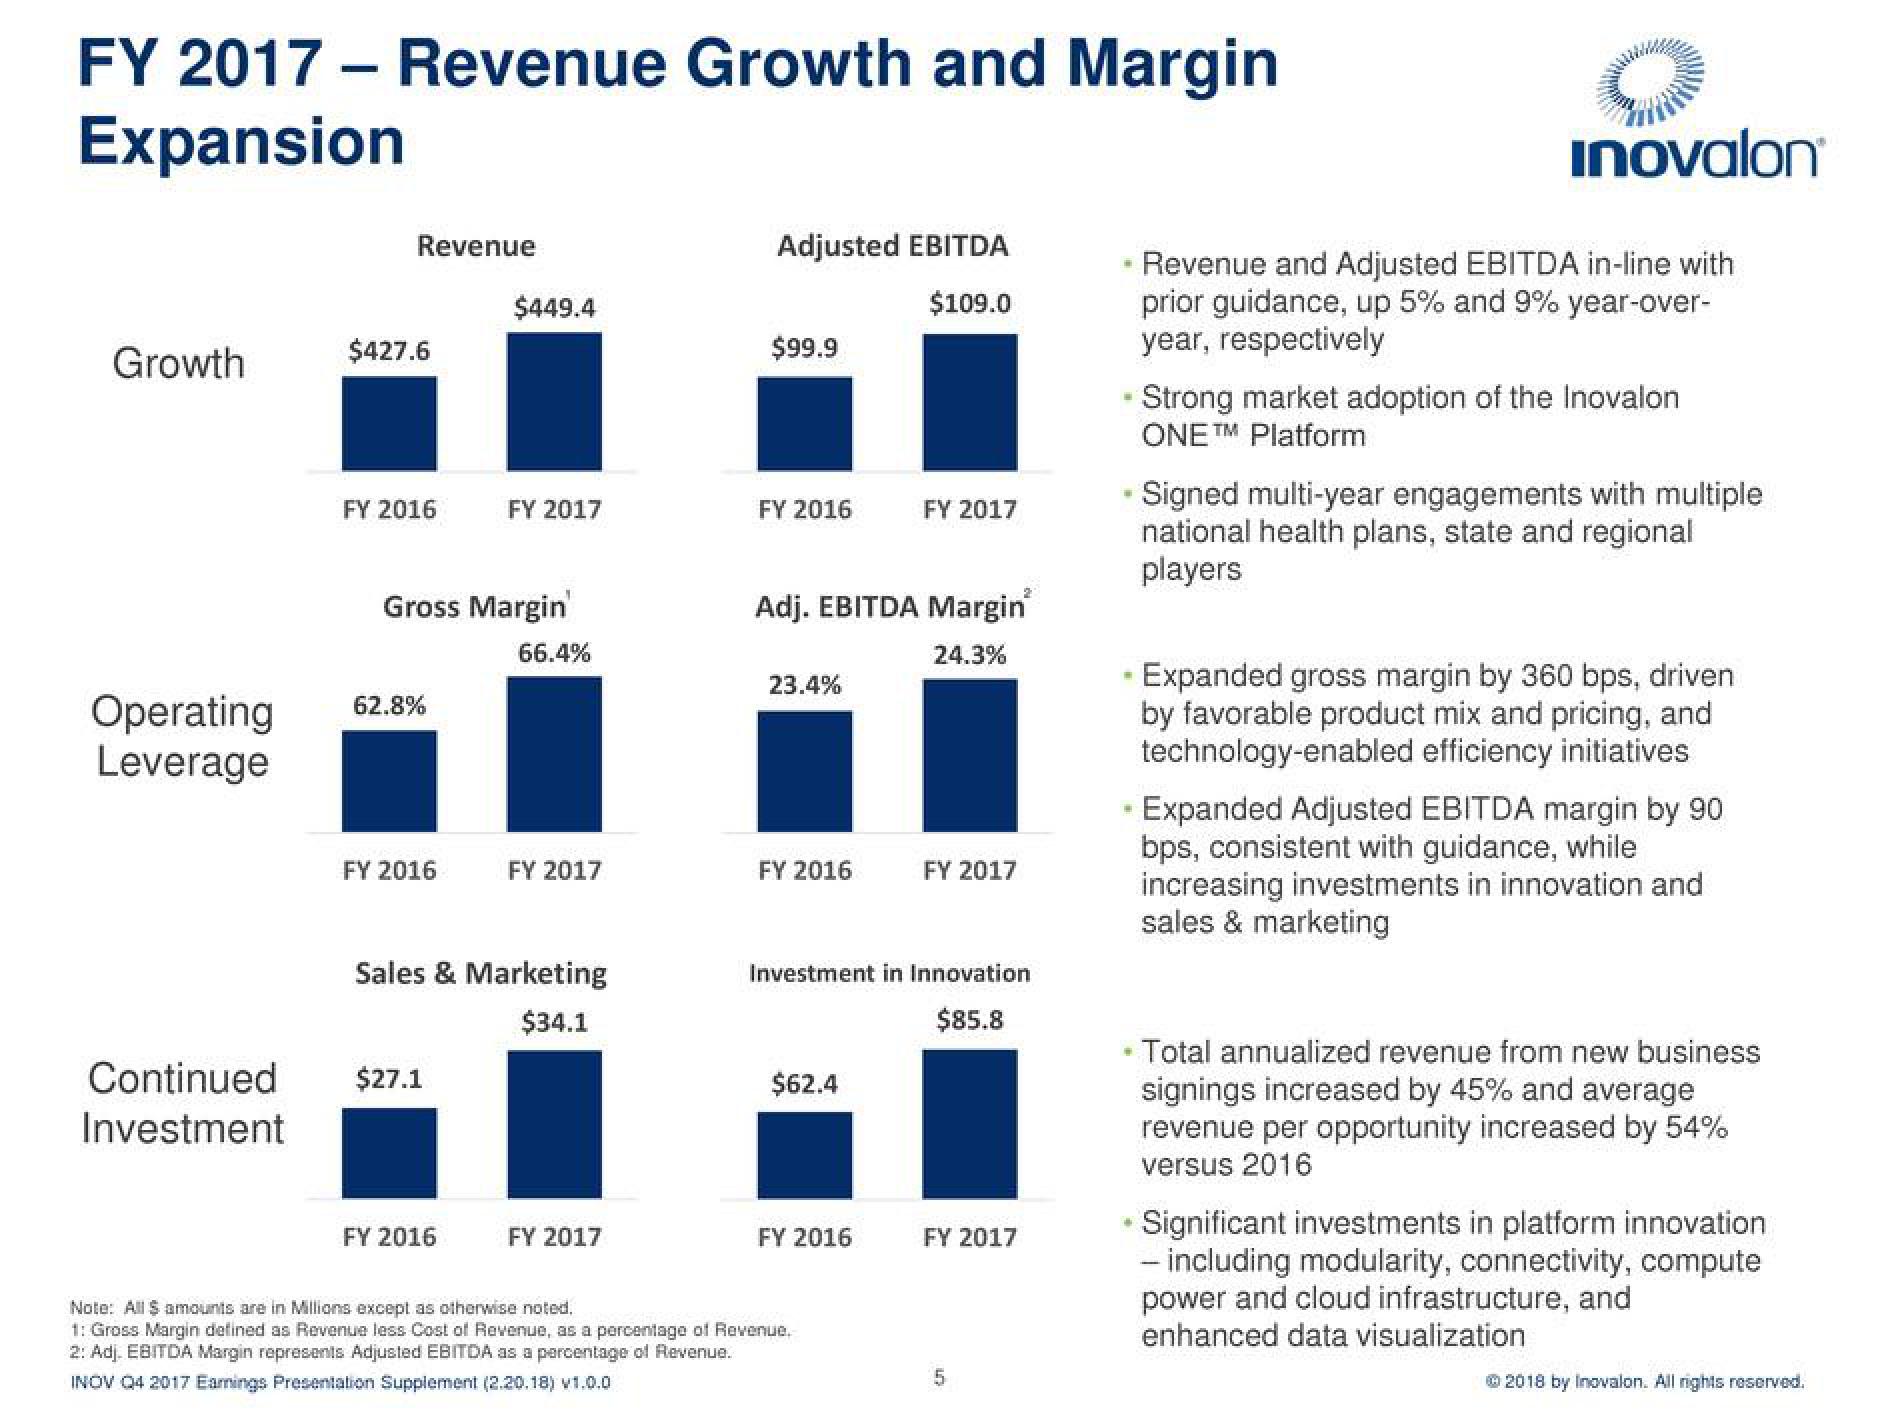
FY 2017 - Revenue Growth and Margin
Expansion
Growth
Operating
Leverage
Continued
Investment
Revenue
$427.6
FY 2016
62.8%
Gross Margin
FY 2016
$449.4
$27.1
FY 2017
FY 2016
66.4%
Sales & Marketing
$34.1
FY 2017
FY 2017
Adjusted EBITDA
$109.0
$99.9
FY 2016
Adj. EBITDA Margin
24.3%
23.4%
FY 2016
$62.4
FY 2017
Investment in Innovation
$85.8
FY 2016
Note: All $ amounts are in Millions except as otherwise noted.
1: Gross Margin defined as Revenue less Cost of Revenue, as a percentage of Revenue.
2: Adj. EBITDA Margin represents Adjusted EBITDA as a percentage of Revenue.
INOV Q4 2017 Earnings Presentation Supplement (2.20.18) v1.0.0
FY 2017
FY 2017
5
i
W
M
inovalon
Revenue and Adjusted EBITDA in-line with
prior guidance, up 5% and 9% year-over-
year, respectively
Strong market adoption of the Inovalon
ONE ™M Platform
Signed multi-year engagements with multiple
national health plans, state and regional
players
Expanded gross margin by 360 bps, driven
by favorable product mix and pricing, and
technology-enabled efficiency initiatives
Expanded Adjusted EBITDA margin by 90
bps, consistent with guidance, while
increasing investments in innovation and
sales & marketing
Total annualized revenue from new business
signings increased by 45% and average
revenue per opportunity increased by 54%
versus 2016
Significant investments in platform innovation
- including modularity, connectivity, compute
power and cloud infrastructure, and
enhanced data visualization
Ⓒ2018 by Inovalon. All rights reserved.View entire presentation