Sonos Results Presentation Deck
Strong Opex Leverage on Higher Sales, Anniversarying Restructuring LY
Research and Development (GAAP)
Restructuring and related charges
Adjusted Research and Development (Non-GAAP)
% of revenue
Sales and Marketing (GAAP)
Restructuring and related charges
Adjusted Sales and Marketing (Non-GAAP)
% of revenue
General and Administrative (GAAP)
Restructuring and related charges
Legal and transaction related costs
Adjusted General and Administrative (Non-GAAP)
% of revenue
Total Operating Expenses (GAAP)
Restructuring and related charges
Legal and transaction related costs
Adjusted Operating Expenses (Non-GAAP)
% of revenue
Q321
$55.6
$55.6
14.7%
$67.2
$67.2
17.8%
$38.3
5.4
$33.0
8.7%
$161.1
5.4
$155.8
41.1%
Q320
$57.8
4.9
$52.8
21.2%
$77.3
19.8
$57.5
23.1%
$31.7
1.4
4.1
$26.1
10.5%
$166.7
26.2
4.1
$136.4
54.7%
Y/Y Change
(3.8)%
(100.0)%
5.2%
(650 bps)
(13.0%)
(100.0)%
17.0%
(530 bps)
21.0%
(100.0)%
29.5%
26.3%
(180 bps)
(3.3)%
(100.0%)
29.5%
14.2%
(1,360 bps)
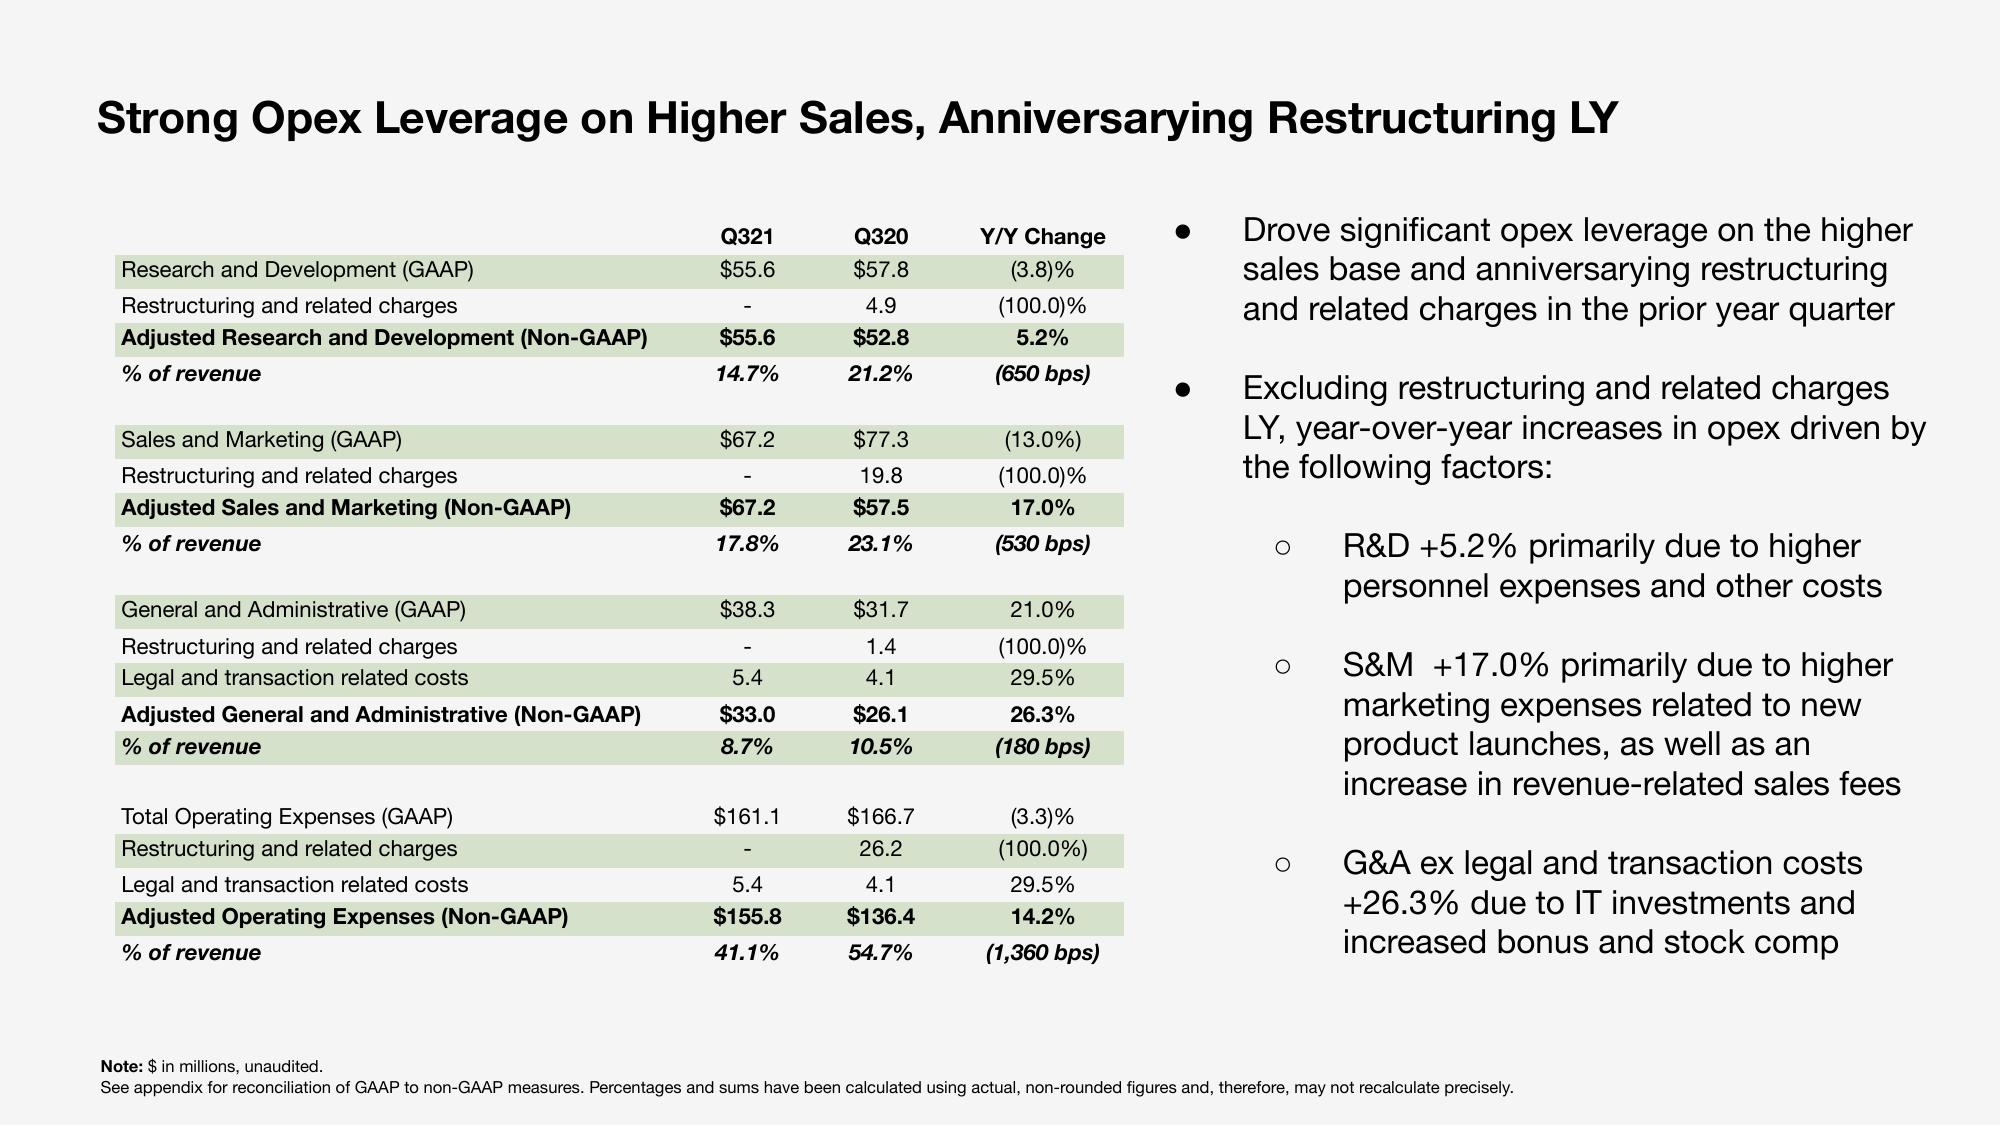
Drove significant opex leverage on the higher
sales base and anniversarying restructuring
and related charges in the prior year quarter
Excluding restructuring and related charges
LY, year-over-year increases in opex driven by
the following factors:
O
O
R&D +5.2% primarily due to higher
personnel expenses and other costs
S&M +17.0% primarily due to higher
marketing expenses related to new
product launches, as well as an
increase in revenue-related sales fees
G&A ex legal and transaction costs
+26.3% due to IT investments and
increased bonus and stock comp
Note: $ in millions, unaudited.
See appendix for reconciliation of GAAP to non-GAAP measures. Percentages and sums have been calculated using actual, non-rounded figures and, therefore, may not recalculate precisely.View entire presentation