Oatly Results Presentation Deck
STRONG TOPLINE MOMENTUM REMAINS ACROSS REGIONS SUPPORTED BY
HIGHER PRODUCTION OUTPUT
Production
volume(¹)
Sales
volume(¹)
57
51
$71
-
EMEA
Q3 2020A
+23%
97
63
$87(3)
Q3 2021A
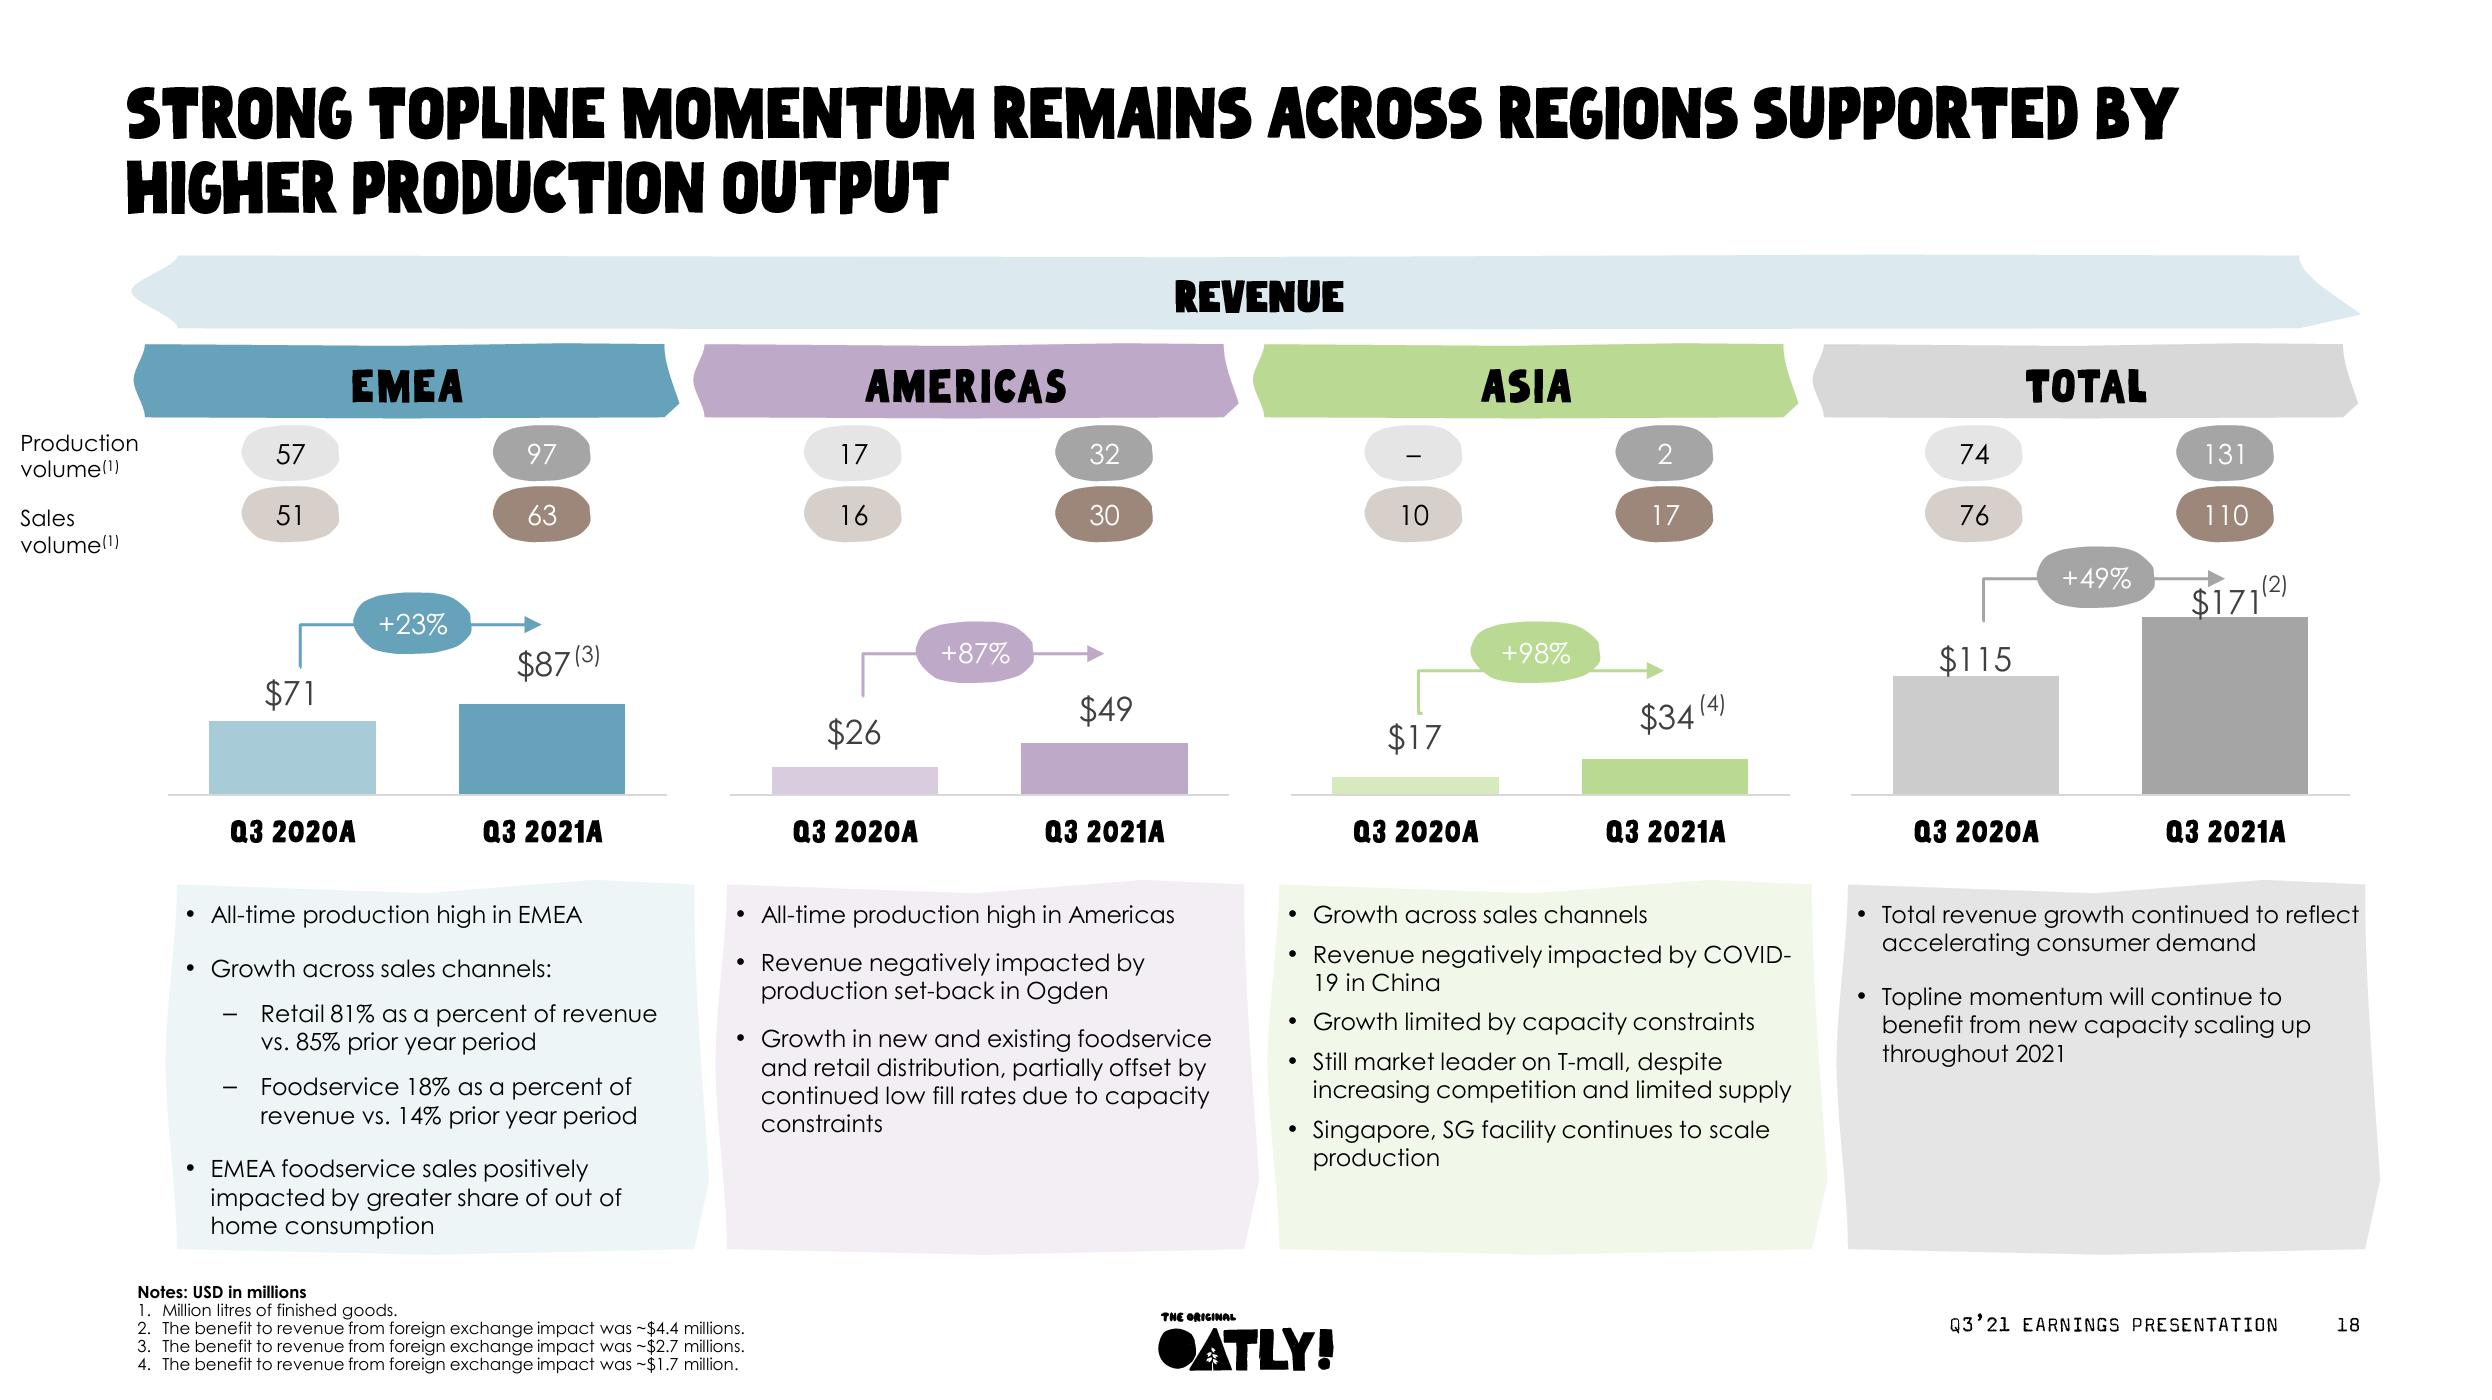
• All-time production high in EMEA
• Growth across sales channels:
Retail 81% as a percent of revenue
vs. 85% prior year period
Foodservice 18% as a percent of
revenue vs. 14% prior year period
EMEA foodservice sales positively
impacted by greater share of out of
home consumption
AMERICAS
17
16
Notes: USD in millions
1. Million litres of finished goods.
2. The benefit to revenue from foreign exchange impact was -$4.4 millions.
3. The benefit to revenue from foreign exchange impact was ~$2.7 millions.
4. The benefit to revenue from foreign exchange impact was -$1.7 million.
$26
Q3 2020A
+87%
32
30
$49
Q3 2021A
REVENUE
• All-time production high in Americas
• Revenue negatively impacted by
production set-back in Ogden
• Growth in new and existing foodservice
and retail distribution, partially offset by
continued low fill rates due to capacity
constraints
THE ORIGINAL
10
●
$17
●ATLY!
ASIA
Q3 2020A
+98%
2
17
$34 (4)
• Growth across sales channels
• Revenue negatively impacted by COVID-
19 in China
Q3 2021A
• Growth limited by capacity constraints
• Still market leader on T-mall, despite
increasing competition and limited supply
Singapore, SG facility continues to scale
production
74
76
●
$115
TOTAL
Q3 2020A
+49%
131
110
$171
Q3 2021A
• Total revenue growth continued to reflect
accelerating consumer demand
Topline momentum will continue to
benefit from new capacity scaling up
throughout 2021
Q3'21 EARNINGS PRESENTATION
18View entire presentation