Snap Inc Investor Presentation Deck
Snap Inc.
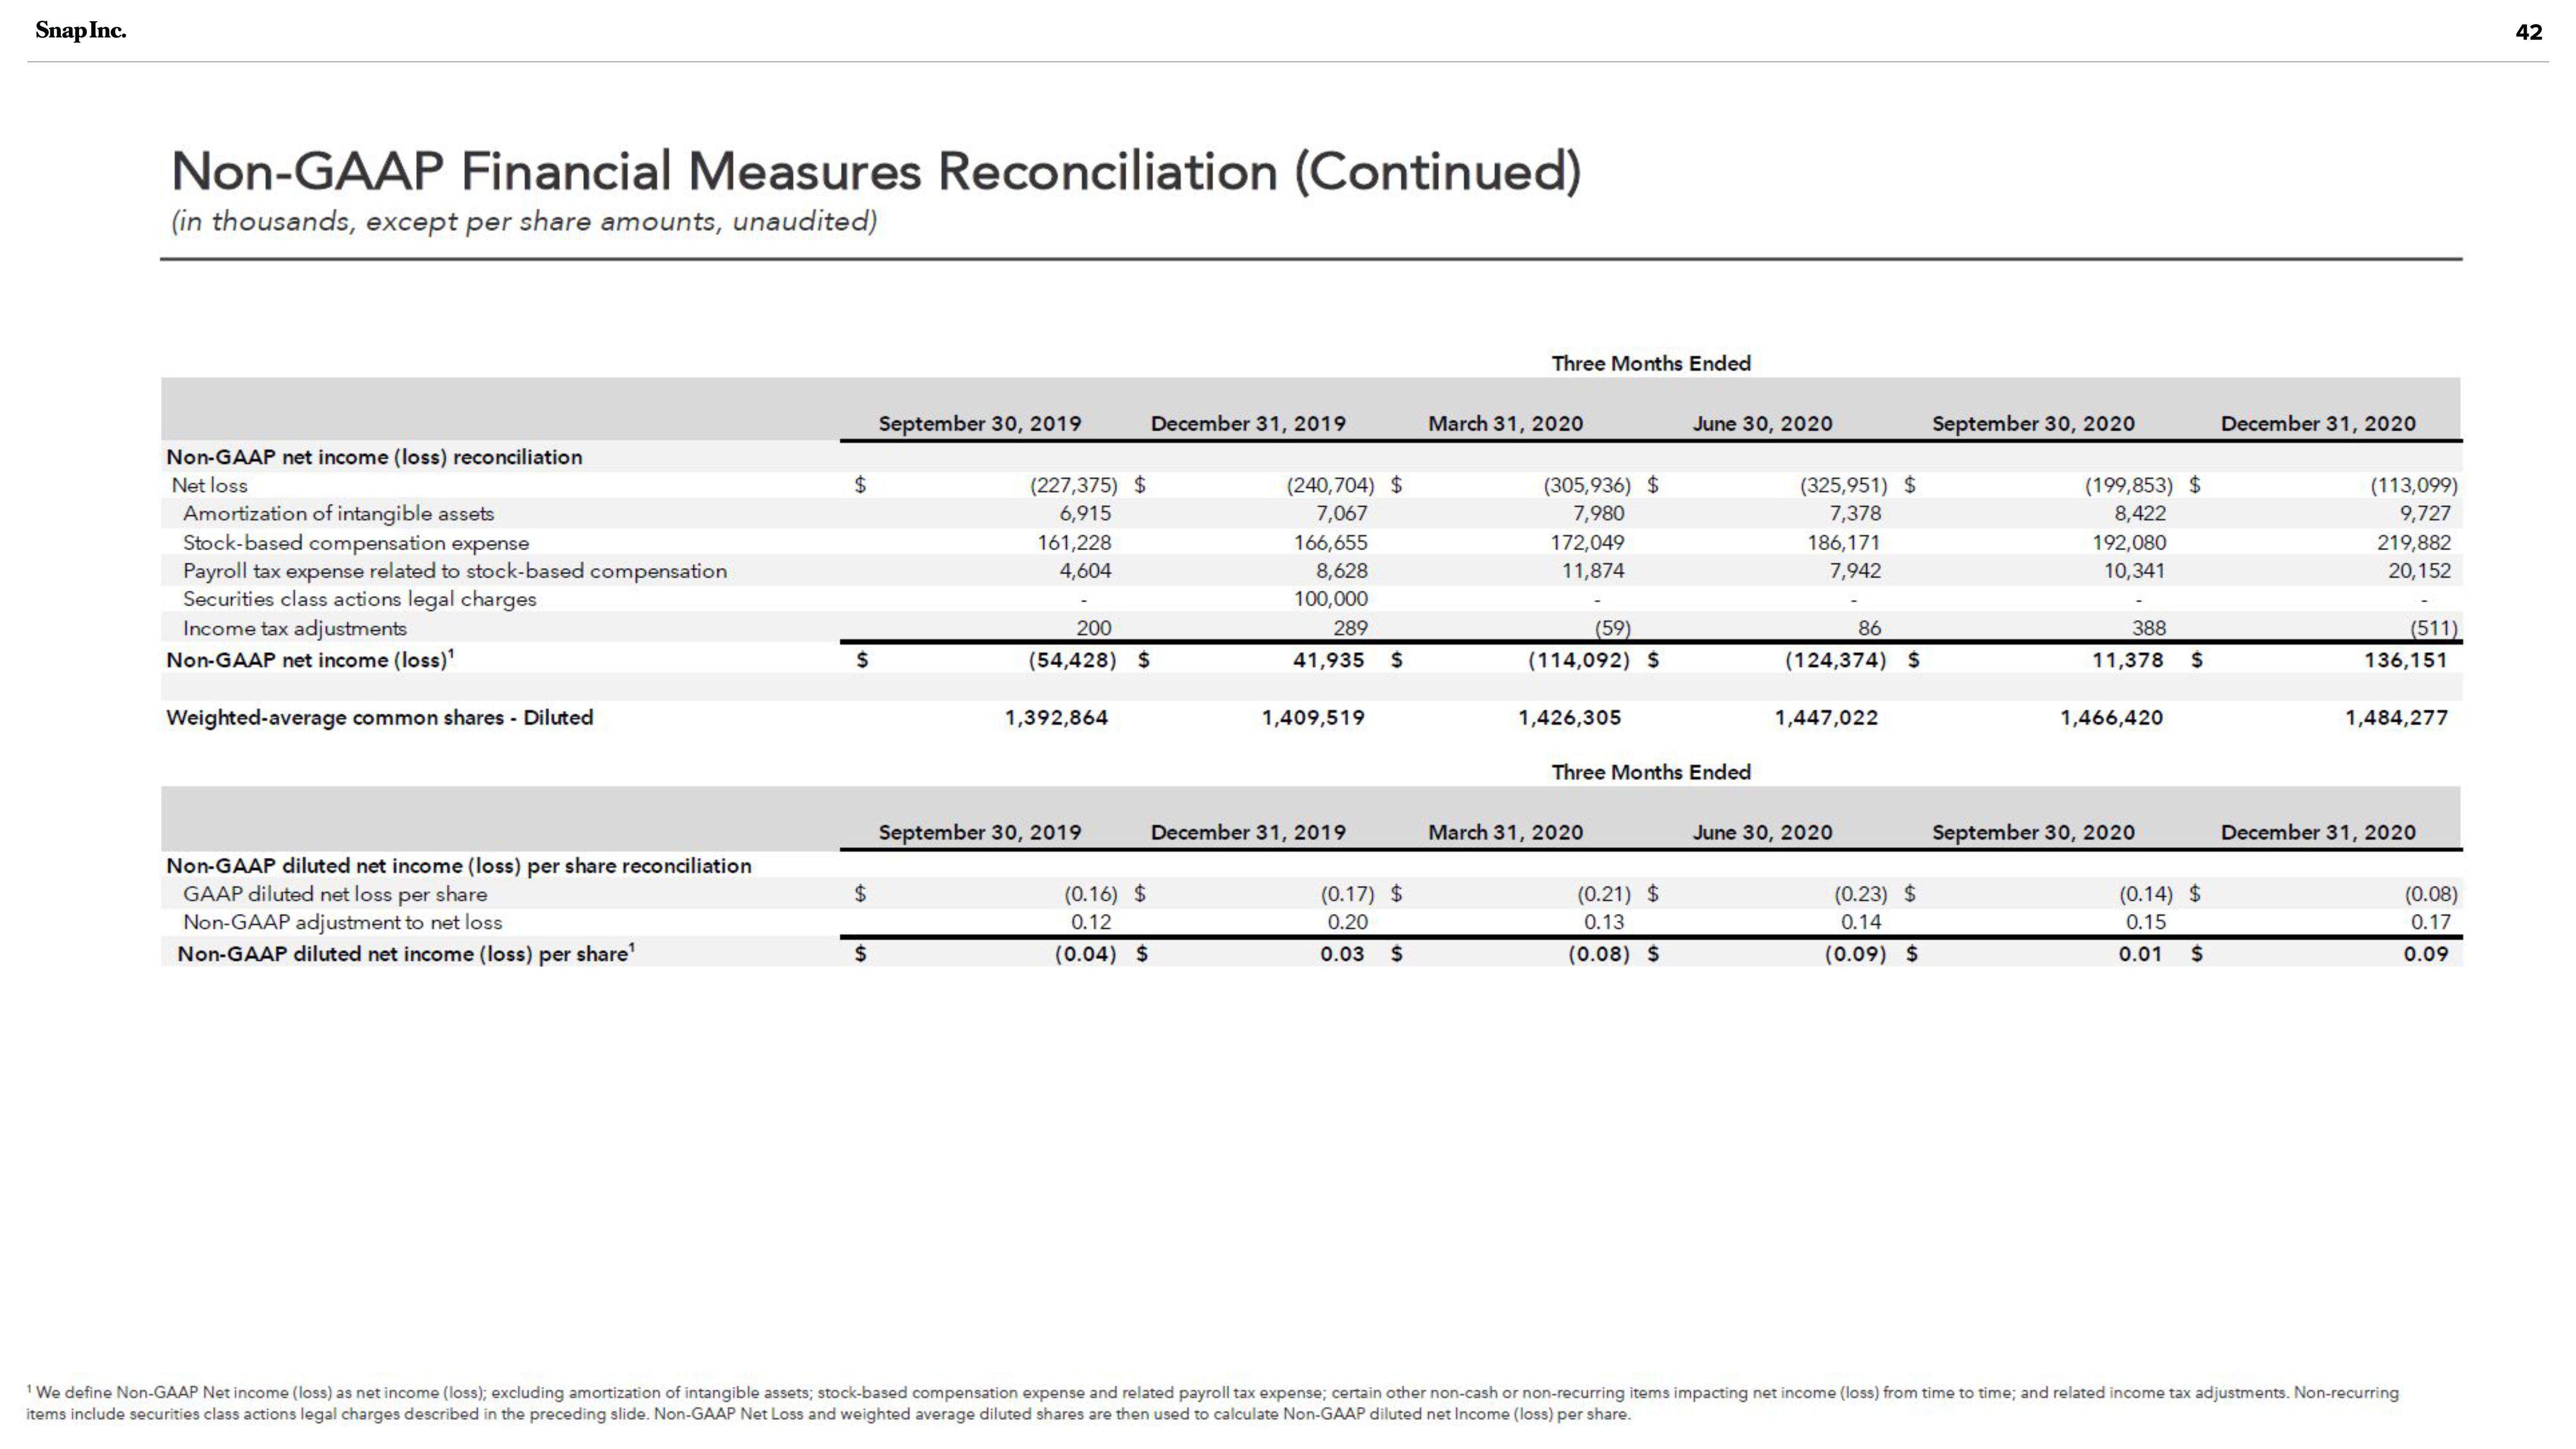
Non-GAAP Financial Measures Reconciliation (Continued)
(in thousands, except per share amounts, unaudited)
Non-GAAP net income (loss) reconciliation
Net loss
Amortization of intangible assets
Stock-based compensation expense
Payroll tax expense related to stock-based compensation
Securities class actions legal charges
Income tax adjustments
Non-GAAP net income (loss)¹
Weighted-average common shares - Diluted
Non-GAAP diluted net income (loss) per share reconciliation
GAAP diluted net loss per share
Non-GAAP adjustment to net loss
Non-GAAP diluted net income (loss) per share¹
$
$
$
September 30, 2019
(227,375) $
6,915
161,228
4,604
200
(54,428) $
1,392,864
September 30, 2019
December 31, 2019
(0.16) $
0.12
(0.04) $
(240,704) $
7,067
166,655
8,628
100,000
289
41,935
1,409,519
December 31, 2019
$
(0.17) $
0.20
0.03 $
Three Months Ended
March 31, 2020
(305,936) $
7,980
172,049
11,874
(59)
(114,092) $
1,426,305
Three Months Ended
March 31, 2020
June 30, 2020
(0.21) $
0.13
(0.08) $
(325,951) $
7,378
186,171
7,942
86
(124,374) $
1,447,022
June 30, 2020
(0.23) $
0.14
(0.09) $
September 30, 2020
(199,853) $
8,422
192,080
10,341
388
11,378 $
1,466,420
September 30, 2020
(0.14) $
0.15
0.01 $
December 31, 2020
(113,099)
9,727
219,882
20,152
(511)
136,151
1,484,277
December 31, 2020
¹ We define Non-GAAP Net income (loss) as net income (loss); excluding amortization of intangible assets; stock-based compensation expense and related payroll tax expense; certain other non-cash or non-recurring items impacting net income (loss) from time to time; and related income tax adjustments. Non-recurring
items include securities class actions legal charges described in the preceding slide. Non-GAAP Net Loss and weighted average diluted shares are then used to calculate Non-GAAP diluted net Income (loss) per share.
(0.08)
0.17
0.09
42View entire presentation