Lanvin Results Presentation Deck
LANVIN 2022 RESULTS AND 2023
GUIDANCE
KEY HIGHLIGHTS
●
●
●
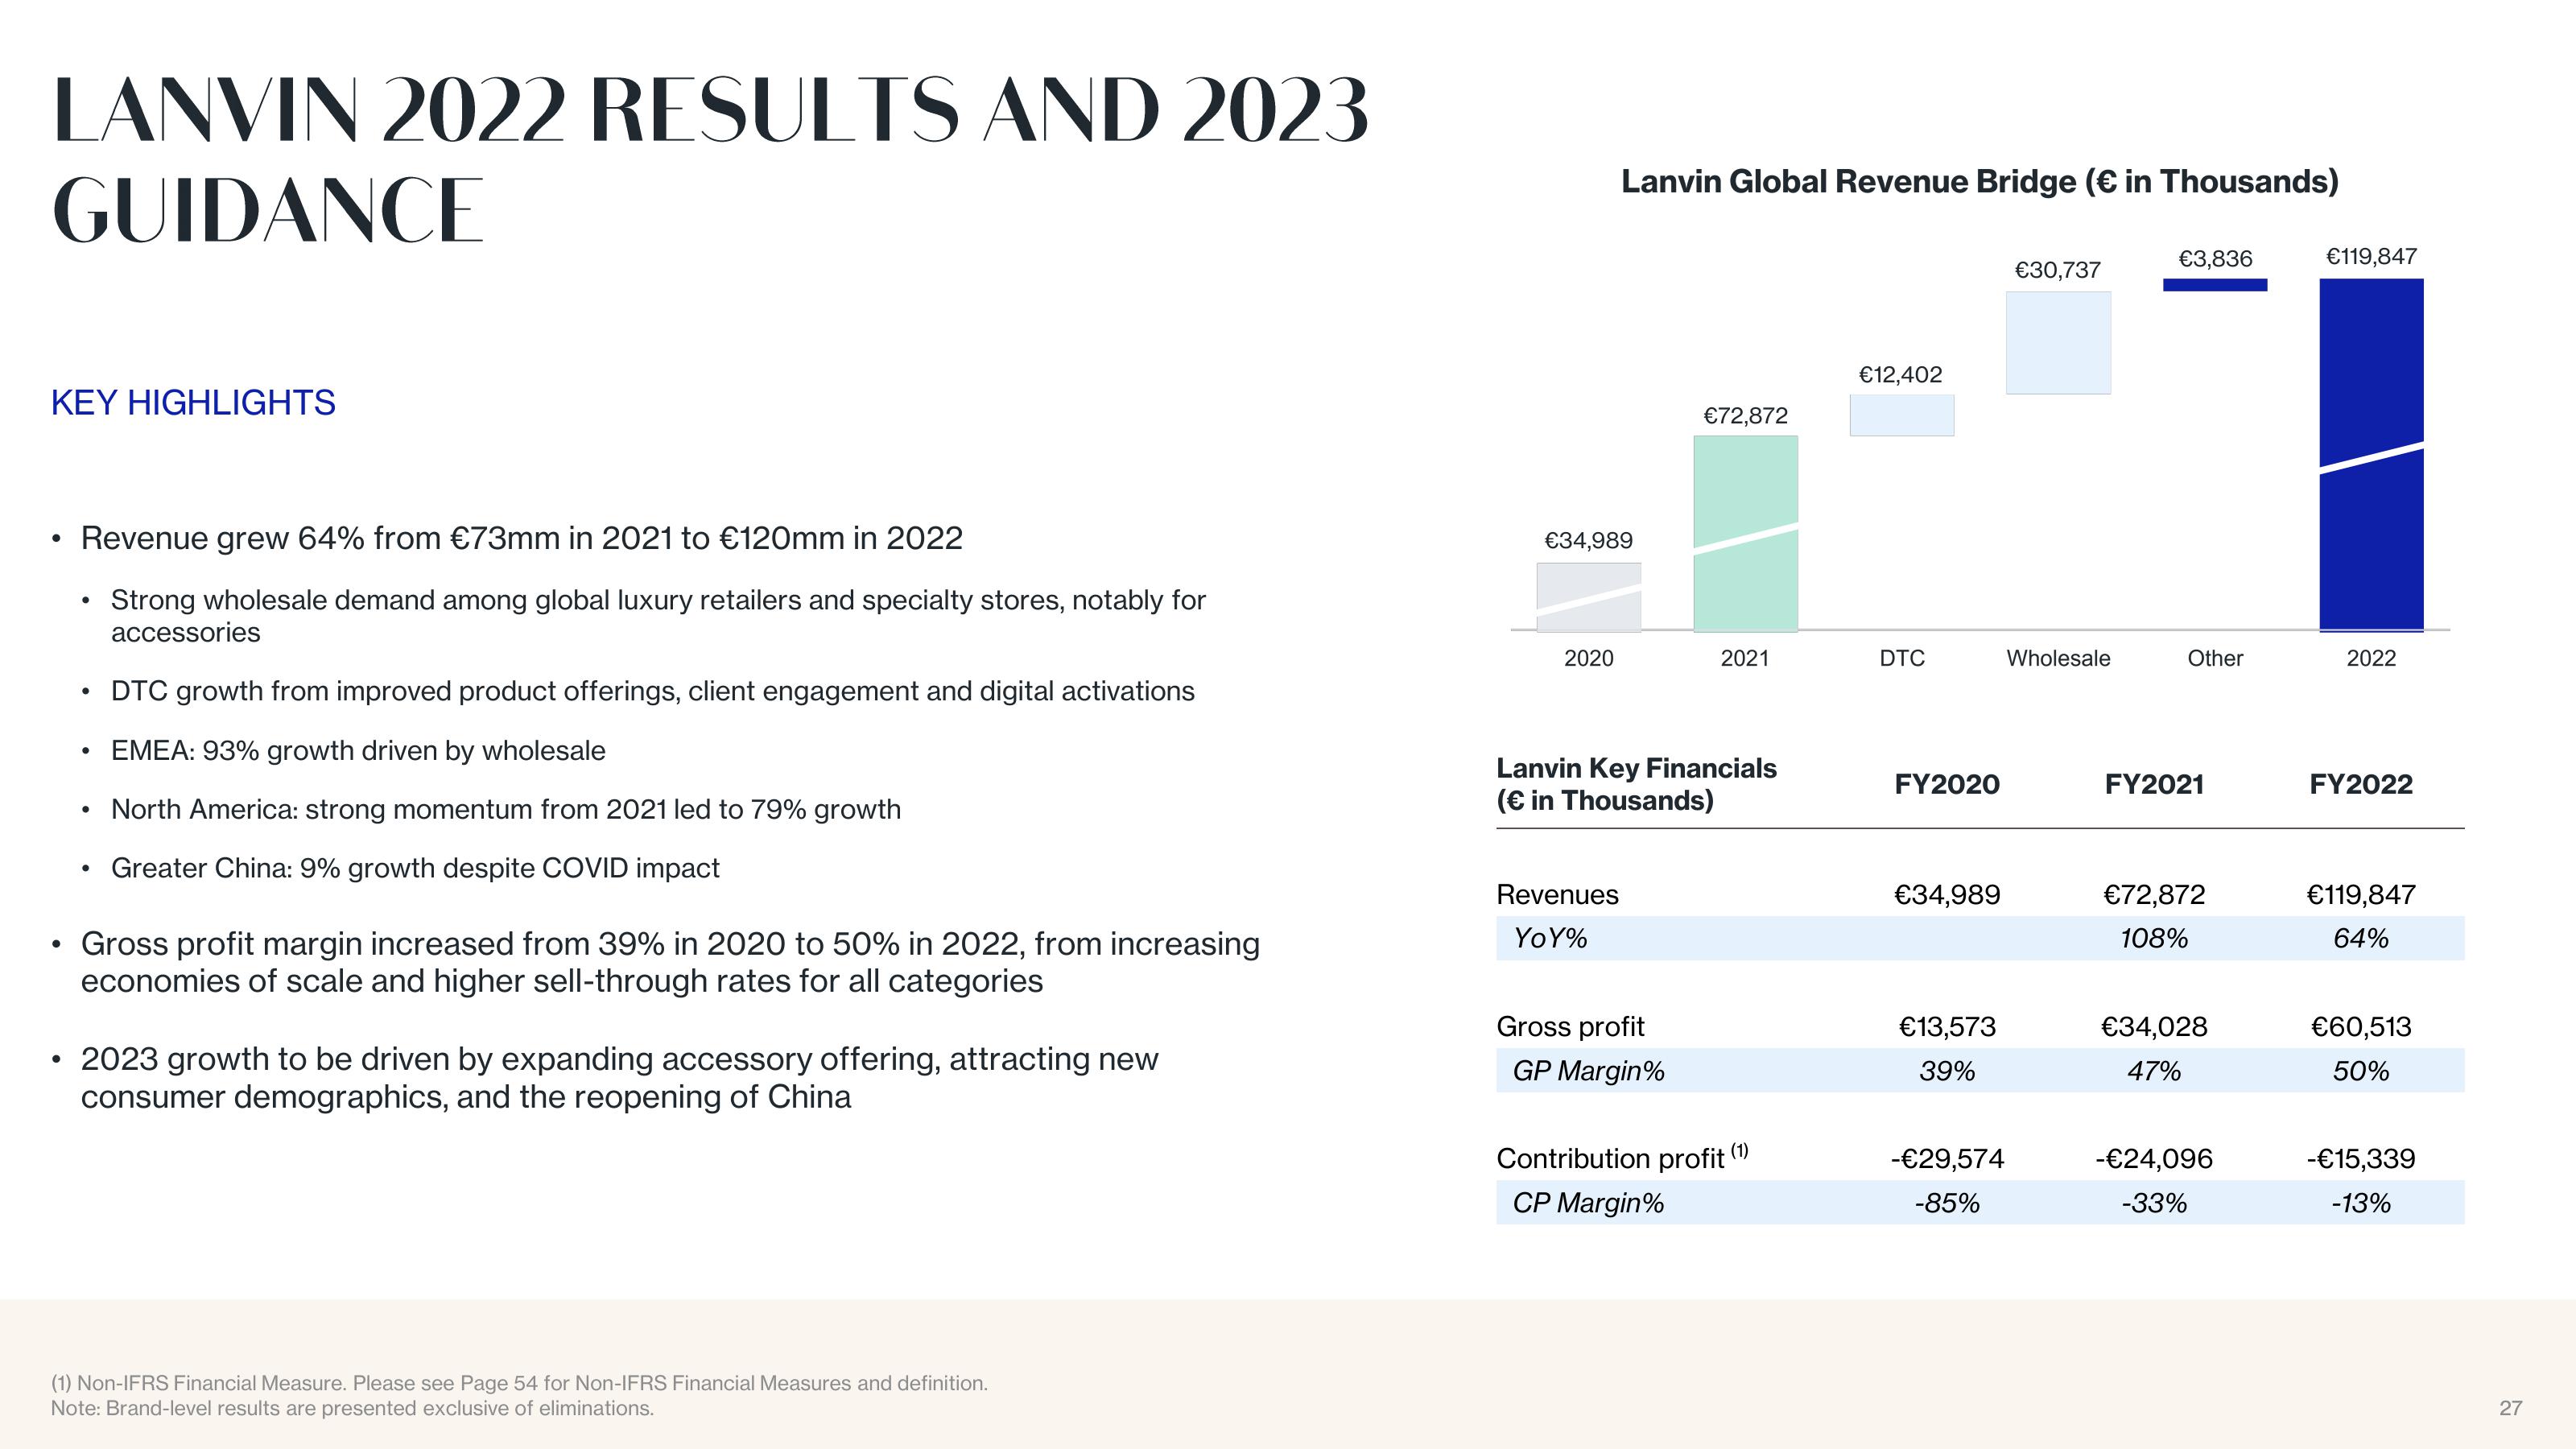
Revenue grew 64% from €73mm in 2021 to €120mm in 2022
Strong wholesale demand among global luxury retailers and specialty stores, notably for
accessories
●
●
●
●
●
DTC growth from improved product offerings, client engagement and digital activations
EMEA: 93% growth driven by wholesale
North America: strong momentum from 2021 led to 79% growth
Greater China: 9% growth despite COVID impact
Gross profit margin increased from 39% in 2020 to 50% in 2022, from increasing
economies of scale and higher sell-through rates for all categories
2023 growth to be driven by expanding accessory offering, attracting new
consumer demographics, and the reopening of China
(1) Non-IFRS Financial Measure. Please see Page 54 for Non-IFRS Financial Measures and definition.
Note: Brand-level results are presented exclusive of eliminations.
€34,989
2020
Lanvin Global Revenue Bridge (€ in Thousands)
Revenues
YoY%
Lanvin Key Financials
(€ in Thousands)
Gross profit
€72,872
GP Margin%
2021
Contribution profit (1)
CP Margin%
€12,402
DTC
FY2020
€34,989
€13,573
39%
€30,737
Wholesale
-€29,574
-85%
€3,836
Other
FY2021
€72,872
108%
€34,028
47%
-€24,096
-33%
€119,847
2022
FY2022
€119,847
64%
€60,513
50%
-€15,339
-13%
27View entire presentation