Kinnevik Results Presentation Deck
Intro
•
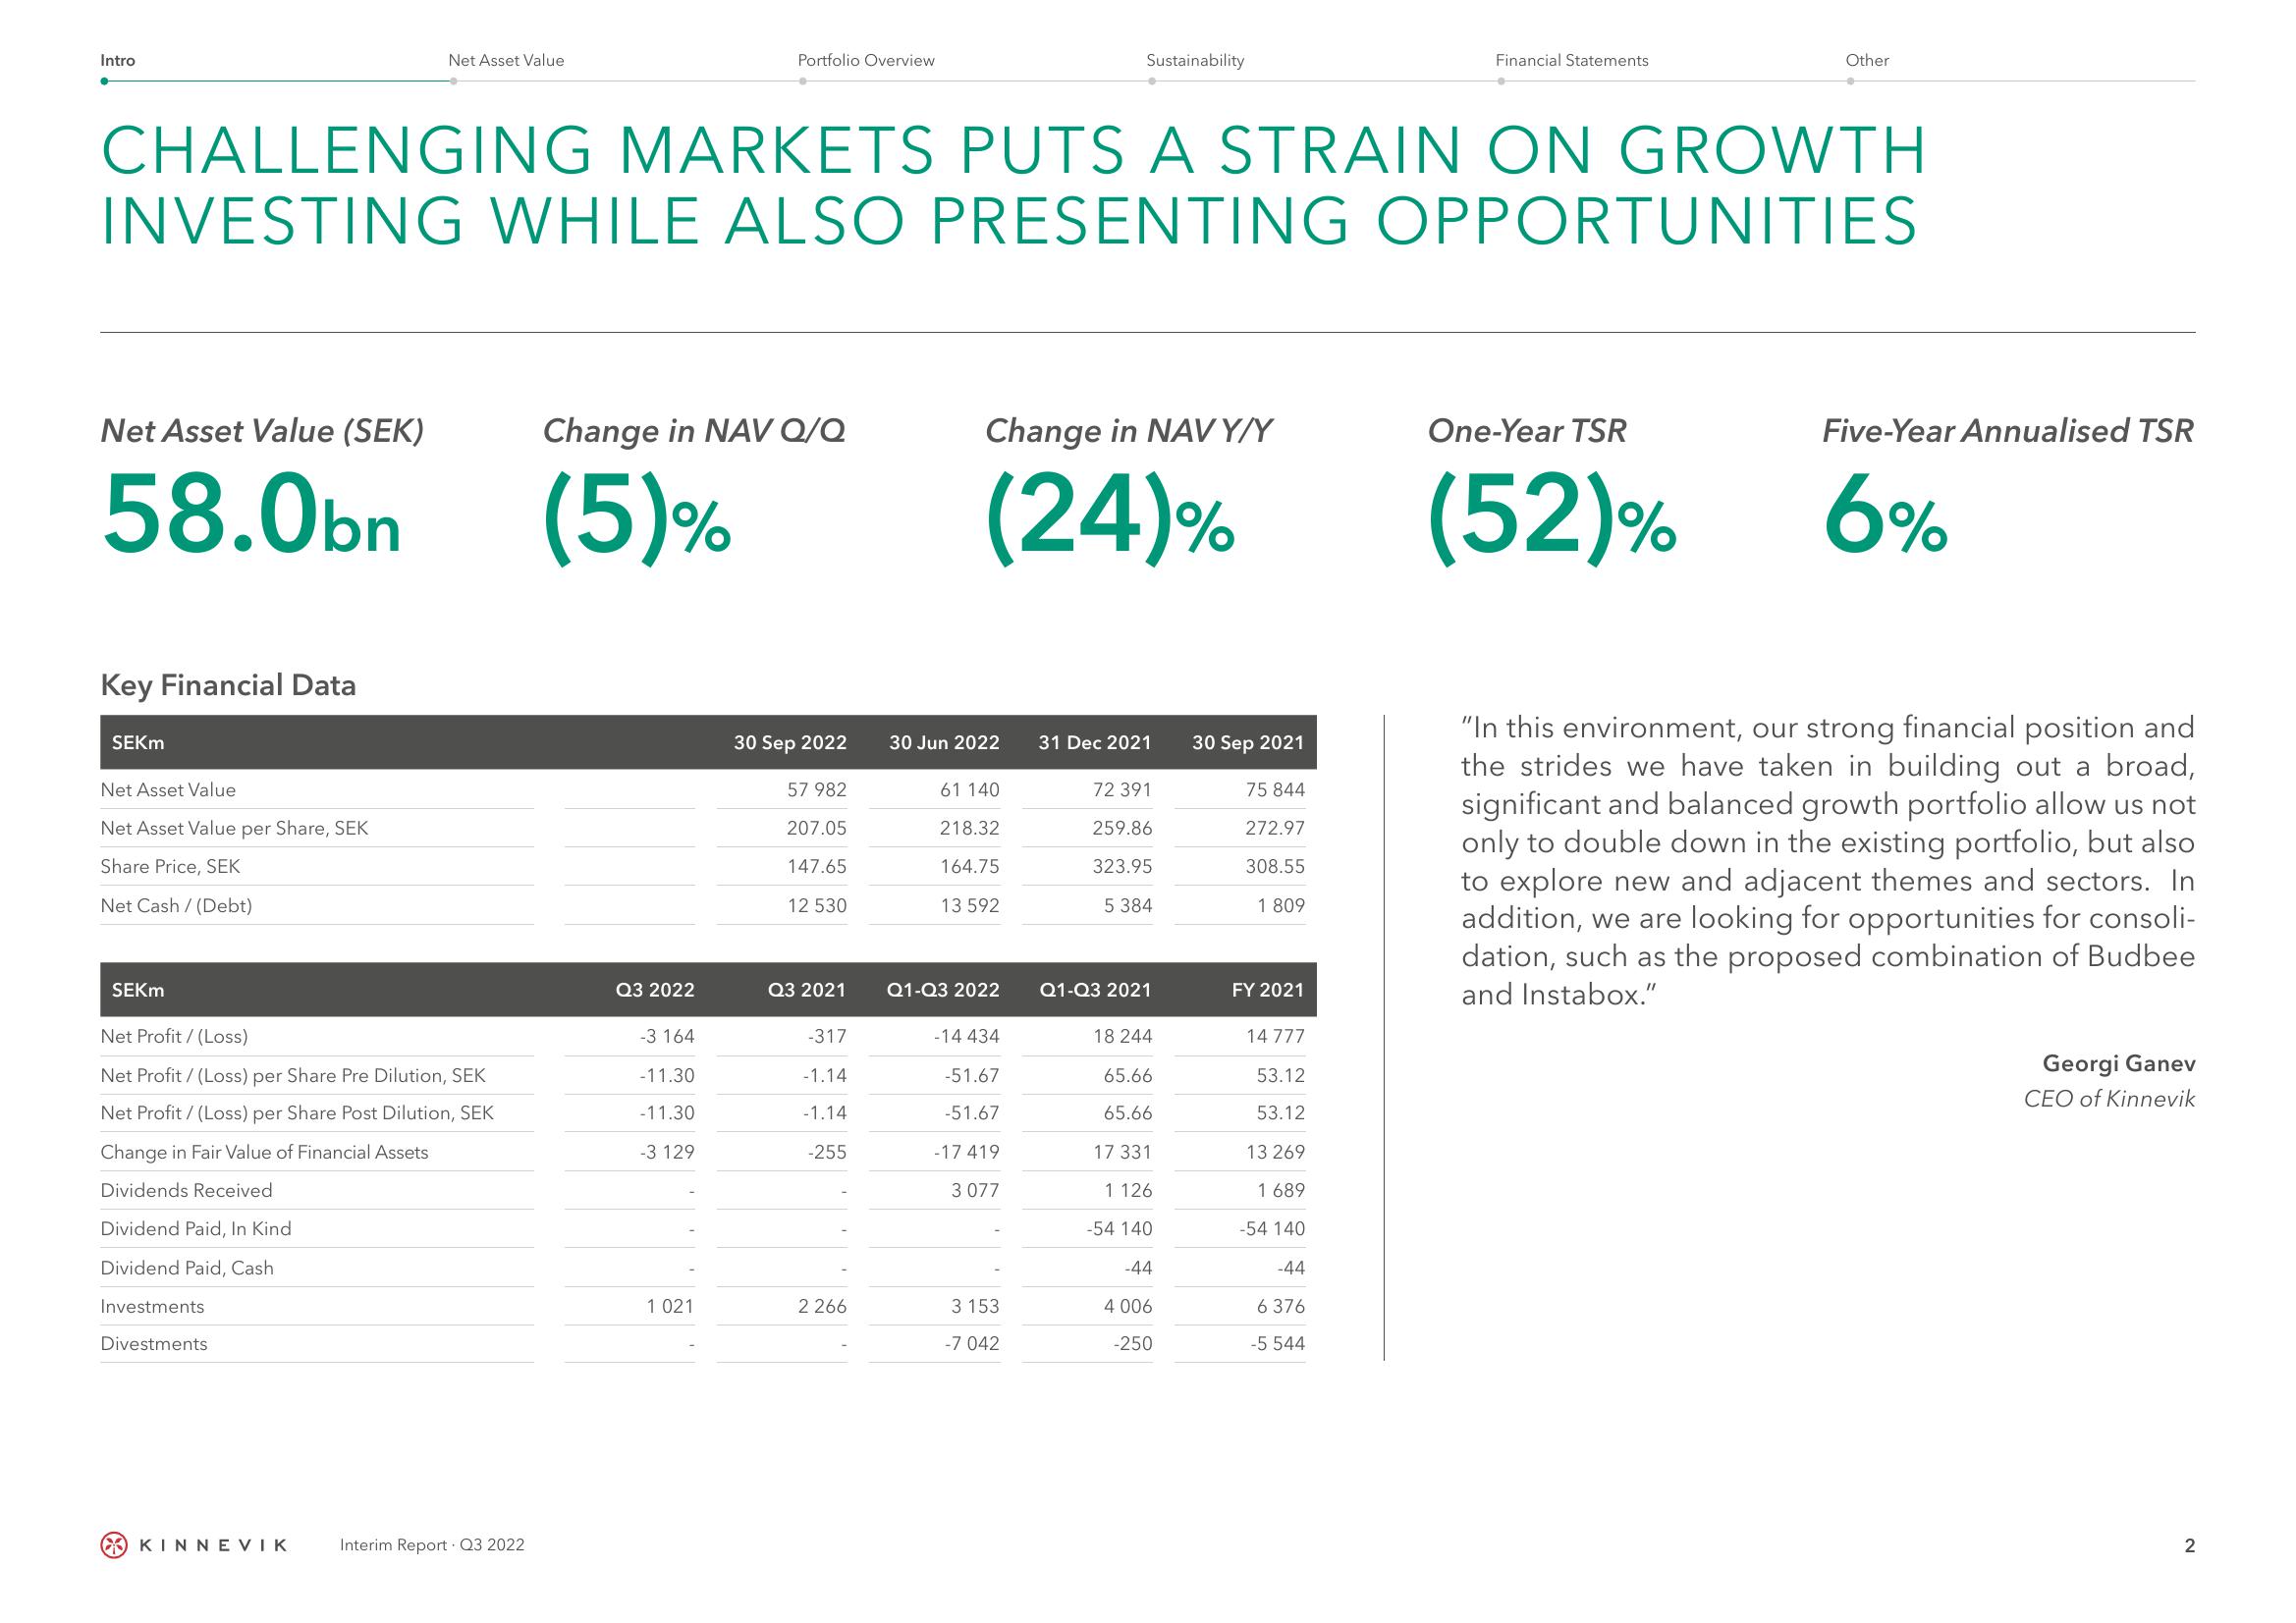
Net Asset Value (SEK)
58.0bn
Key Financial Data
SEKM
Net Asset Value
Net Asset Value per Share, SEK
Share Price, SEK
Net Cash/ (Debt)
CHALLENGING MARKETS PUTS A STRAIN ON GROWTH
INVESTING WHILE ALSO PRESENTING OPPORTUNITIES
SEKM
Net Asset Value
Net Profit/(Loss)
Net Profit / (Loss) per Share Pre Dilution, SEK
Net Profit / (Loss) per Share Post Dilution, SEK
Change in Fair Value of Financial Assets
Dividends Received
Dividend Paid, In Kind
Dividend Paid, Cash
Investments
Divestments
KINNEVIK
Interim Report Q3 2022
Change in NAV Q/Q
(5)%
Q3 2022
-3 164
-11.30
-11.30
Portfolio Overview
-3 129
1 021
30 Sep 2022
57 982
207.05
147.65
12 530
Q3 2021
-317
-1.14
-1.14
-255
2 266
Change in NAVY/Y
(24)%
30 Jun 2022 31 Dec 2021
61 140
218.32
164.75
13 592
Q1-Q3 2022
Sustainability
-14 434
-51.67
-51.67
-17 419
3 077
3 153
-7 042
72 391
259.86
323.95
5 384
Q1-Q3 2021
18 244
65.66
65.66
17 331
1 126
-54 140
-44
4 006
-250
30 Sep 2021
75 844
272.97
308.55
1 809
FY 2021
14 777
53.12
53.12
13 269
1 689
-54 140
Financial Statements
-44
6 376
-5 544
Other
One-Year TSR
(52)%
Five-Year Annualised TSR
6%
"In this environment, our strong financial position and
the strides we have taken in building out a broad,
significant and balanced growth portfolio allow us not
only to double down in the existing portfolio, but also
to explore new and adjacent themes and sectors. In
addition, we are looking for opportunities for consoli-
dation, such as the proposed combination of Budbee
and Instabox."
Georgi Ganev
CEO of Kinnevik
2View entire presentation