Snap Inc Results Presentation Deck
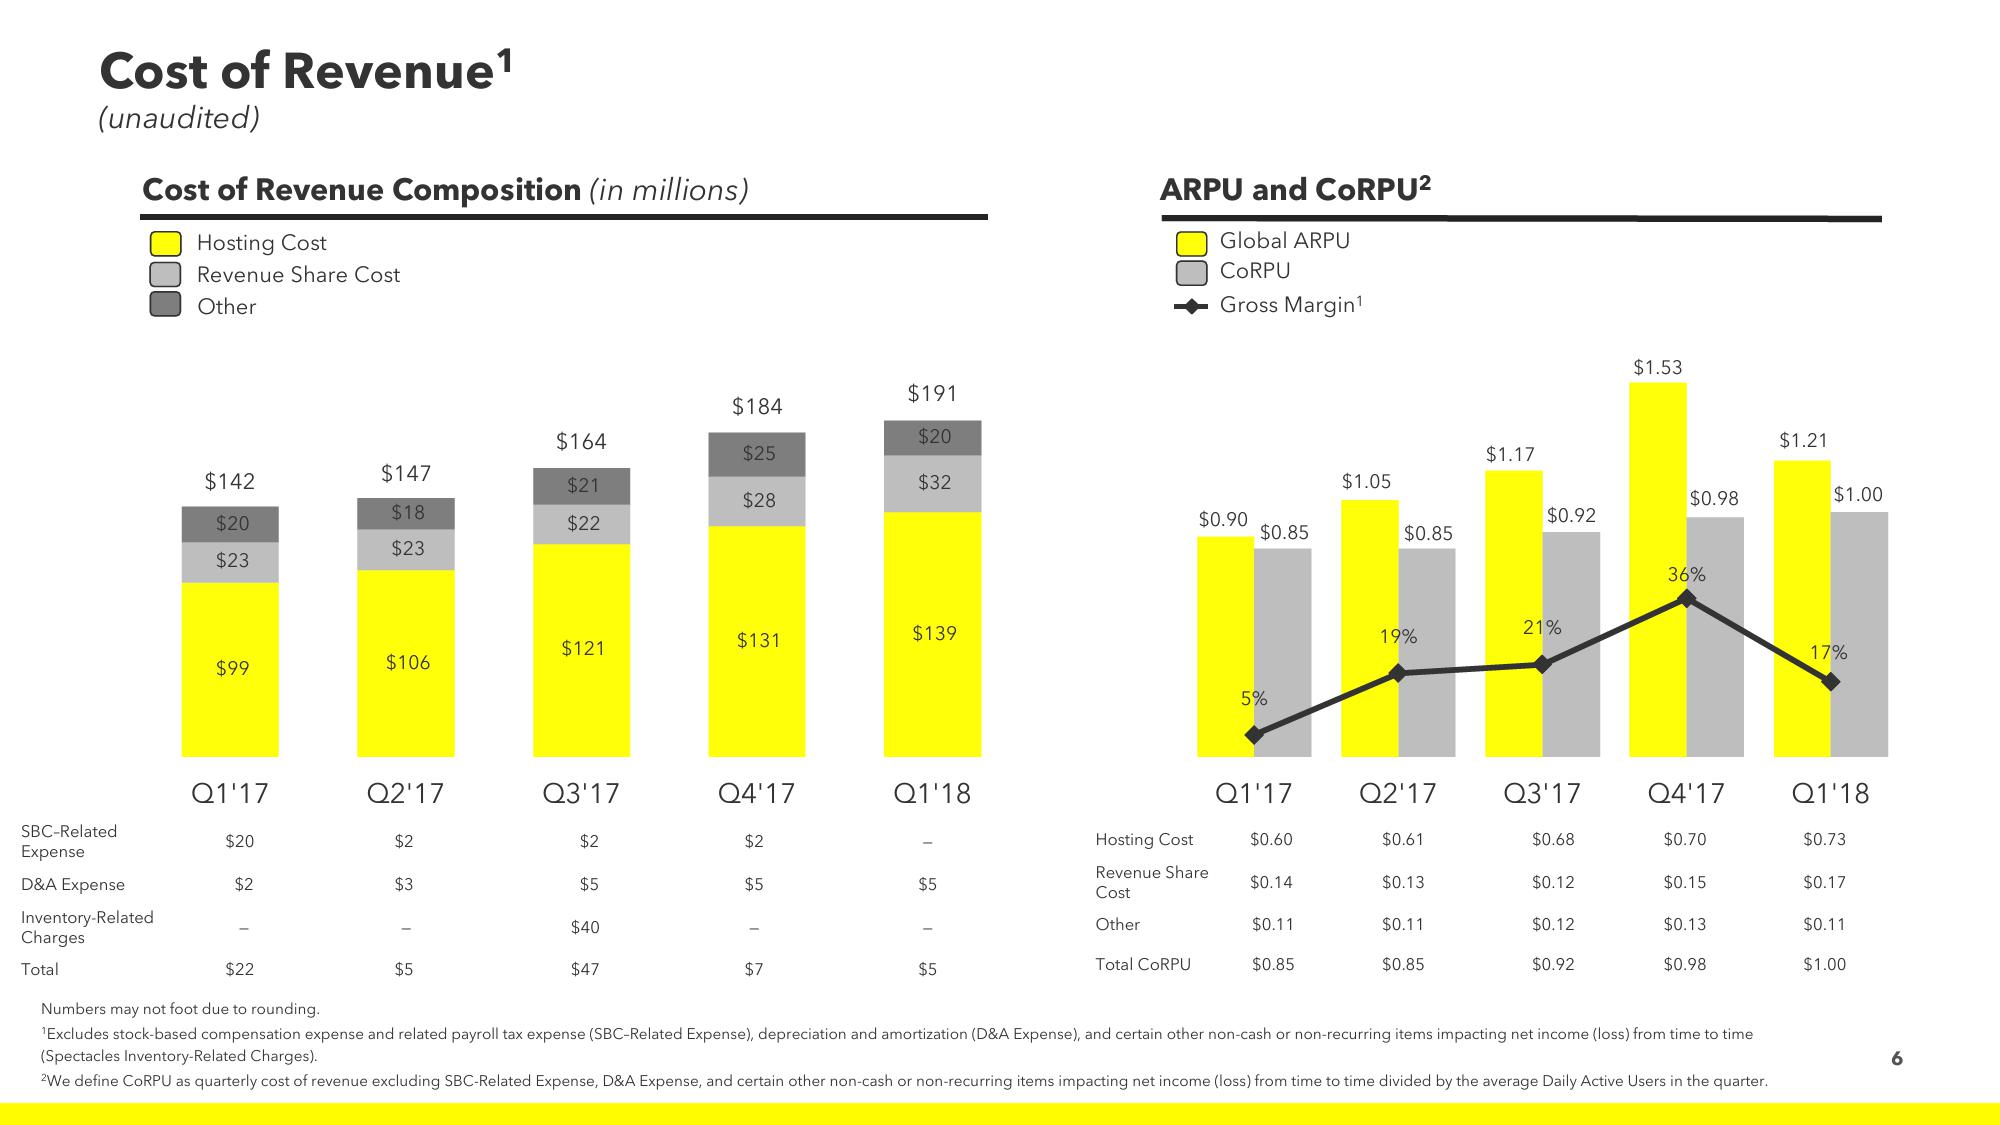
Cost of Revenue¹
(unaudited)
Cost of Revenue Composition (in millions)
Hosting Cost
Revenue Share Cost
Other
SBC-Related
Expense
D&A Expense
Inventory-Related
Charges:
Total
$142
$20
$23
$99
Q1'17
$20
$2
$22
$147
$18
$23
$106
Q2'17
$2
$3
$5
$164
$21
$22
$121
Q3'17
$2
$5
$40
$47
$184
$25
$28
$131
Q4'17
$2
$5
$7
$191
$20
$32
$139
Q1'18
$5
$5
ARPU and CORPU²
Hosting Cost
Revenue Share
Cost
Other
Total CORPU
Global ARPU
CORPU
Gross Margin¹
$0.90
$0.85
5%
Q1'17
$0.60
$0.14
$0.11
$0.85
$1.05
$0.85
19%
Q2'17
$0.61
$0.13
$0.11
$0.85
$1.17
$0.92
21%
Q3'17
$0.68
$0.12
$0.12
$0.92
$1.53
$0.98
36%
Q4'17
$0.70
$0.15
$0.13
$0.98
Numbers may not foot due to rounding.
¹Excludes stock-based compensation expense and related payroll tax expense (SBC-Related Expense), depreciation and amortization (D&A Expense), and certain other non-cash or non-recurring items impacting net income (loss) from time to time
(Spectacles Inventory-Related Charges).
2We define CORPU as quarterly cost of revenue excluding SBC-Related Expense, D&A Expense, and certain other non-cash or non-recurring items impacting net income (loss) from time to time divided by the average Daily Active Users in the quarter.
$1.21
$1.00
17%
Q1'18
$0.73
$0.17
$0.11
$1.00
6View entire presentation