Third Quarter 2019 Results
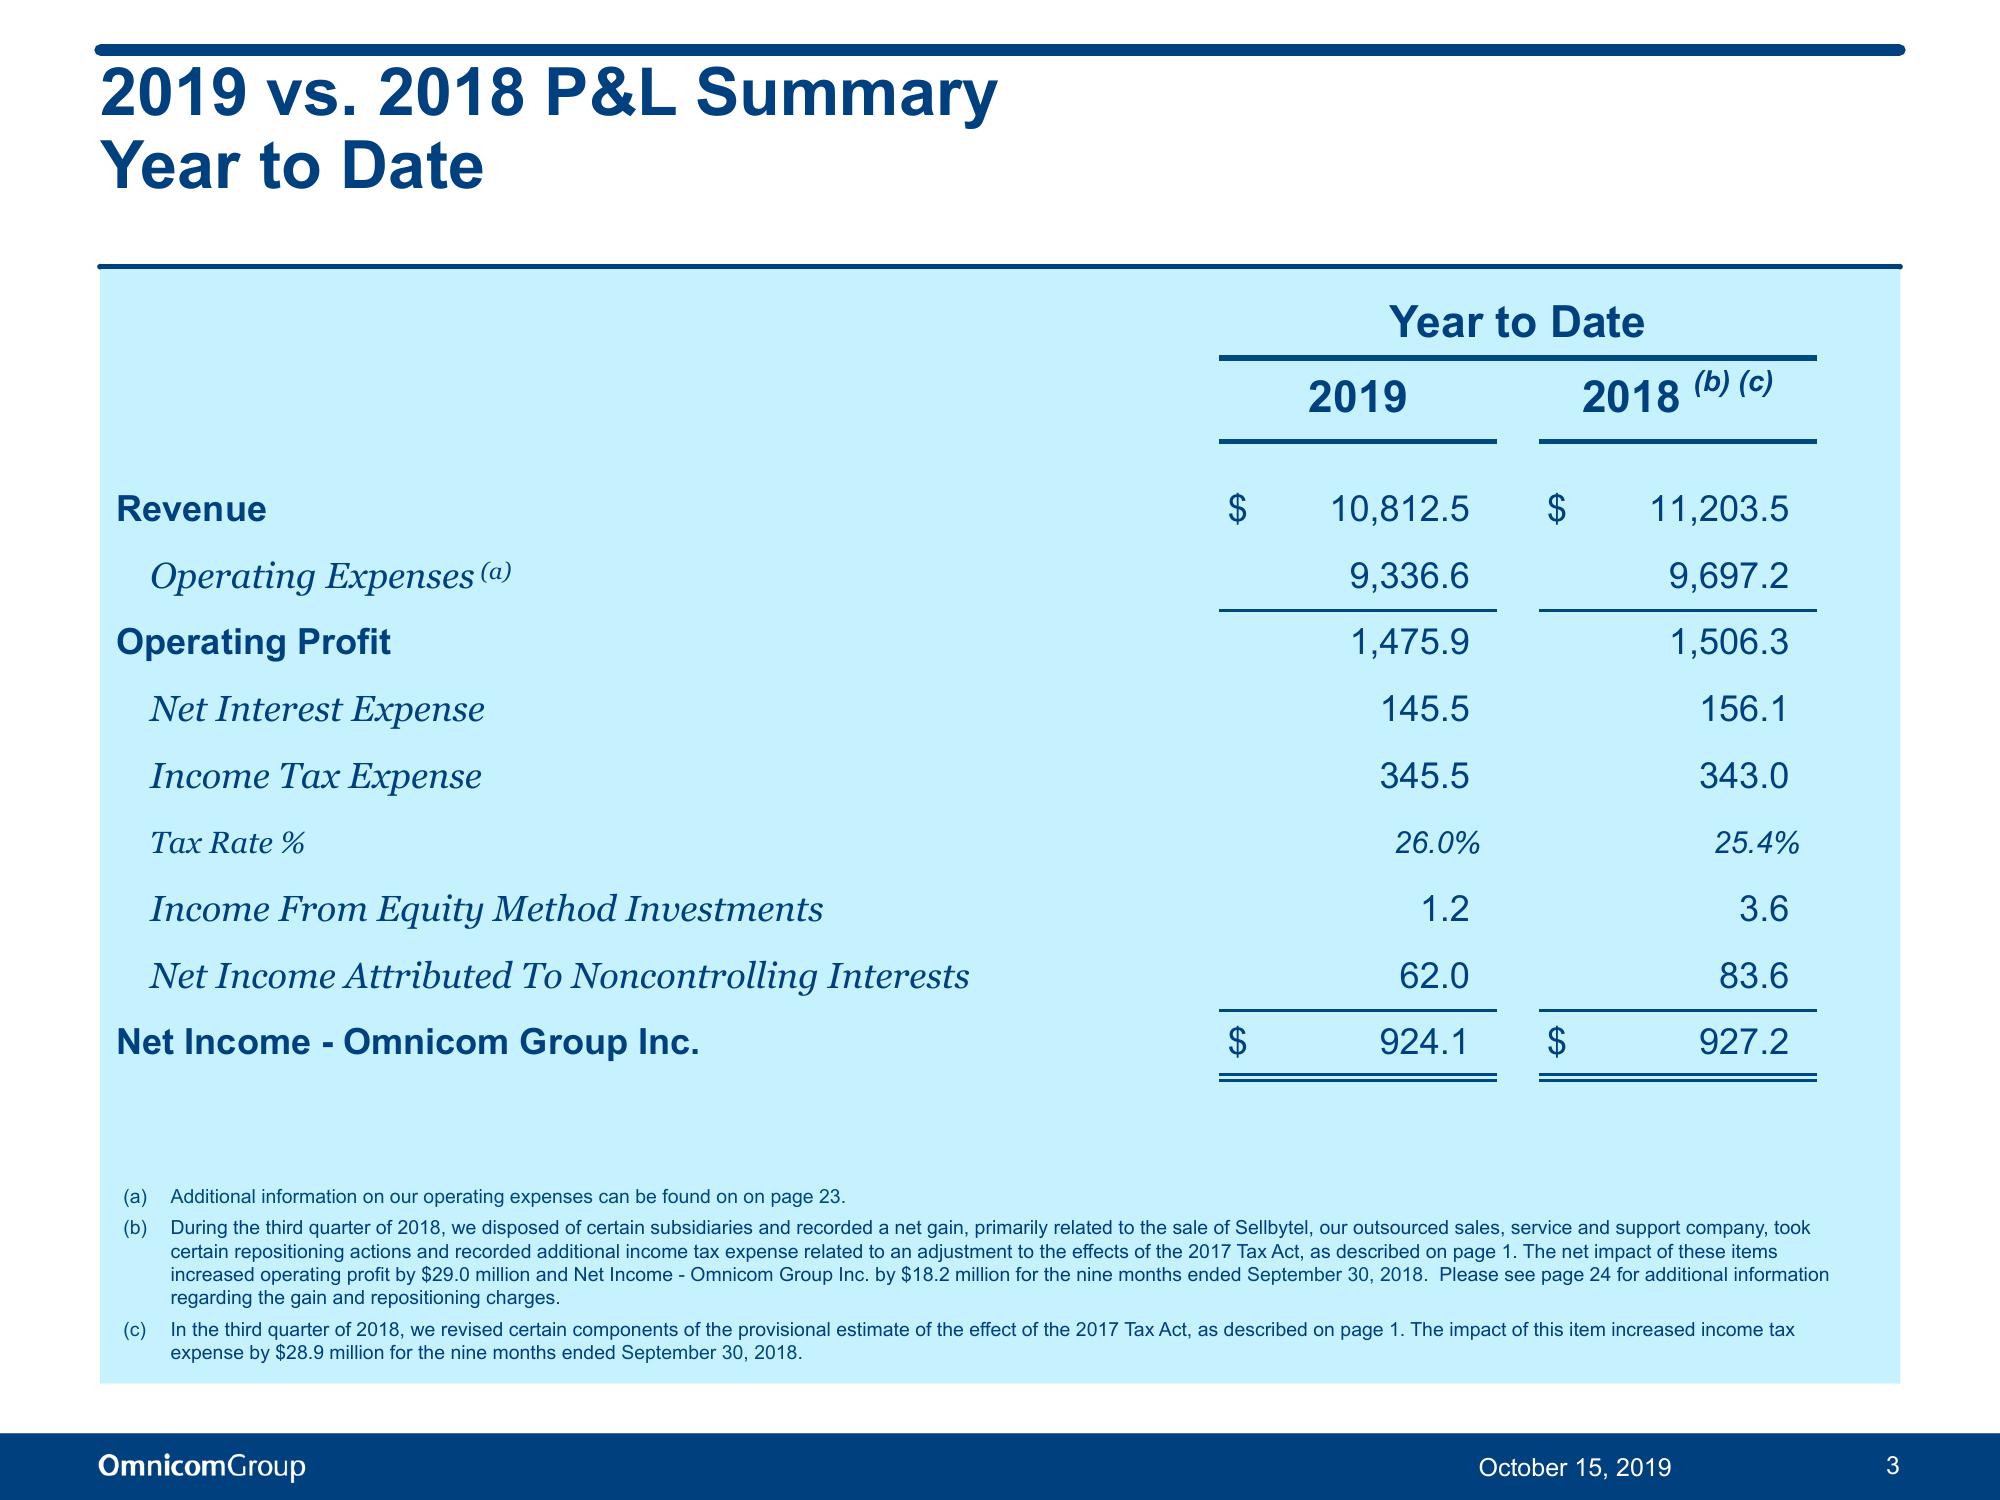
2019 vs. 2018 P&L Summary
Year to Date
Revenue
Operating Expenses (a)
Operating Profit
Net Interest Expense
Income Tax Expense
Tax Rate %
Income From Equity Method Investments
Net Income Attributed To Noncontrolling Interests
Net Income - Omnicom Group Inc.
$
$
OmnicomGroup
Year to Date
2019
10,812.5
9,336.6
1,475.9
145.5
345.5
26.0%
1.2
62.0
924.1
$
2018 (b) (c)
11,203.5
9,697.2
1,506.3
156.1
343.0
(a) Additional information on our operating expenses can be found on on page 23.
(b)
During the third quarter of 2018, we disposed of certain subsidiaries and recorded a net gain, primarily related to the sale of Sellbytel, our outsourced sales, service and support company, took
certain repositioning actions and recorded additional income tax expense related to an adjustment to the effects of the 2017 Tax Act, as described on page 1. The net impact of these items
increased operating profit by $29.0 million and Net Income - Omnicom Group Inc. by $18.2 million for the nine months ended September 30, 2018. Please see page 24 for additional information
regarding the gain and repositioning charges.
25.4%
3.6
83.6
927.2
(c)
In the third quarter of 2018, we revised certain components of the provisional estimate of the effect of the 2017 Tax Act, as described on page 1. The impact of this item increased income tax
expense by $28.9 million for the nine months ended September 30, 2018.
October 15, 2019
3View entire presentation