Comcast Results Presentation Deck
Sky 1st Quarter 2020 Overview
8
Customer Relationships
23.7
+4%
1Q19
Revenue
$4,797
1Q19
24.0
+4%
2Q19
(3.7%)
$4,517
1Q20
23.9
+2%
3Q19
$663
1Q19
24.0
All percentages represent year/year constant currency growth rates.
See Notes on Slide 12
+2%
4Q19
23.9
+1%
($M) Adjusted EBITDA ($M)
1Q20
(15.3%)
$551
(M)
1Q20
Commentary
●
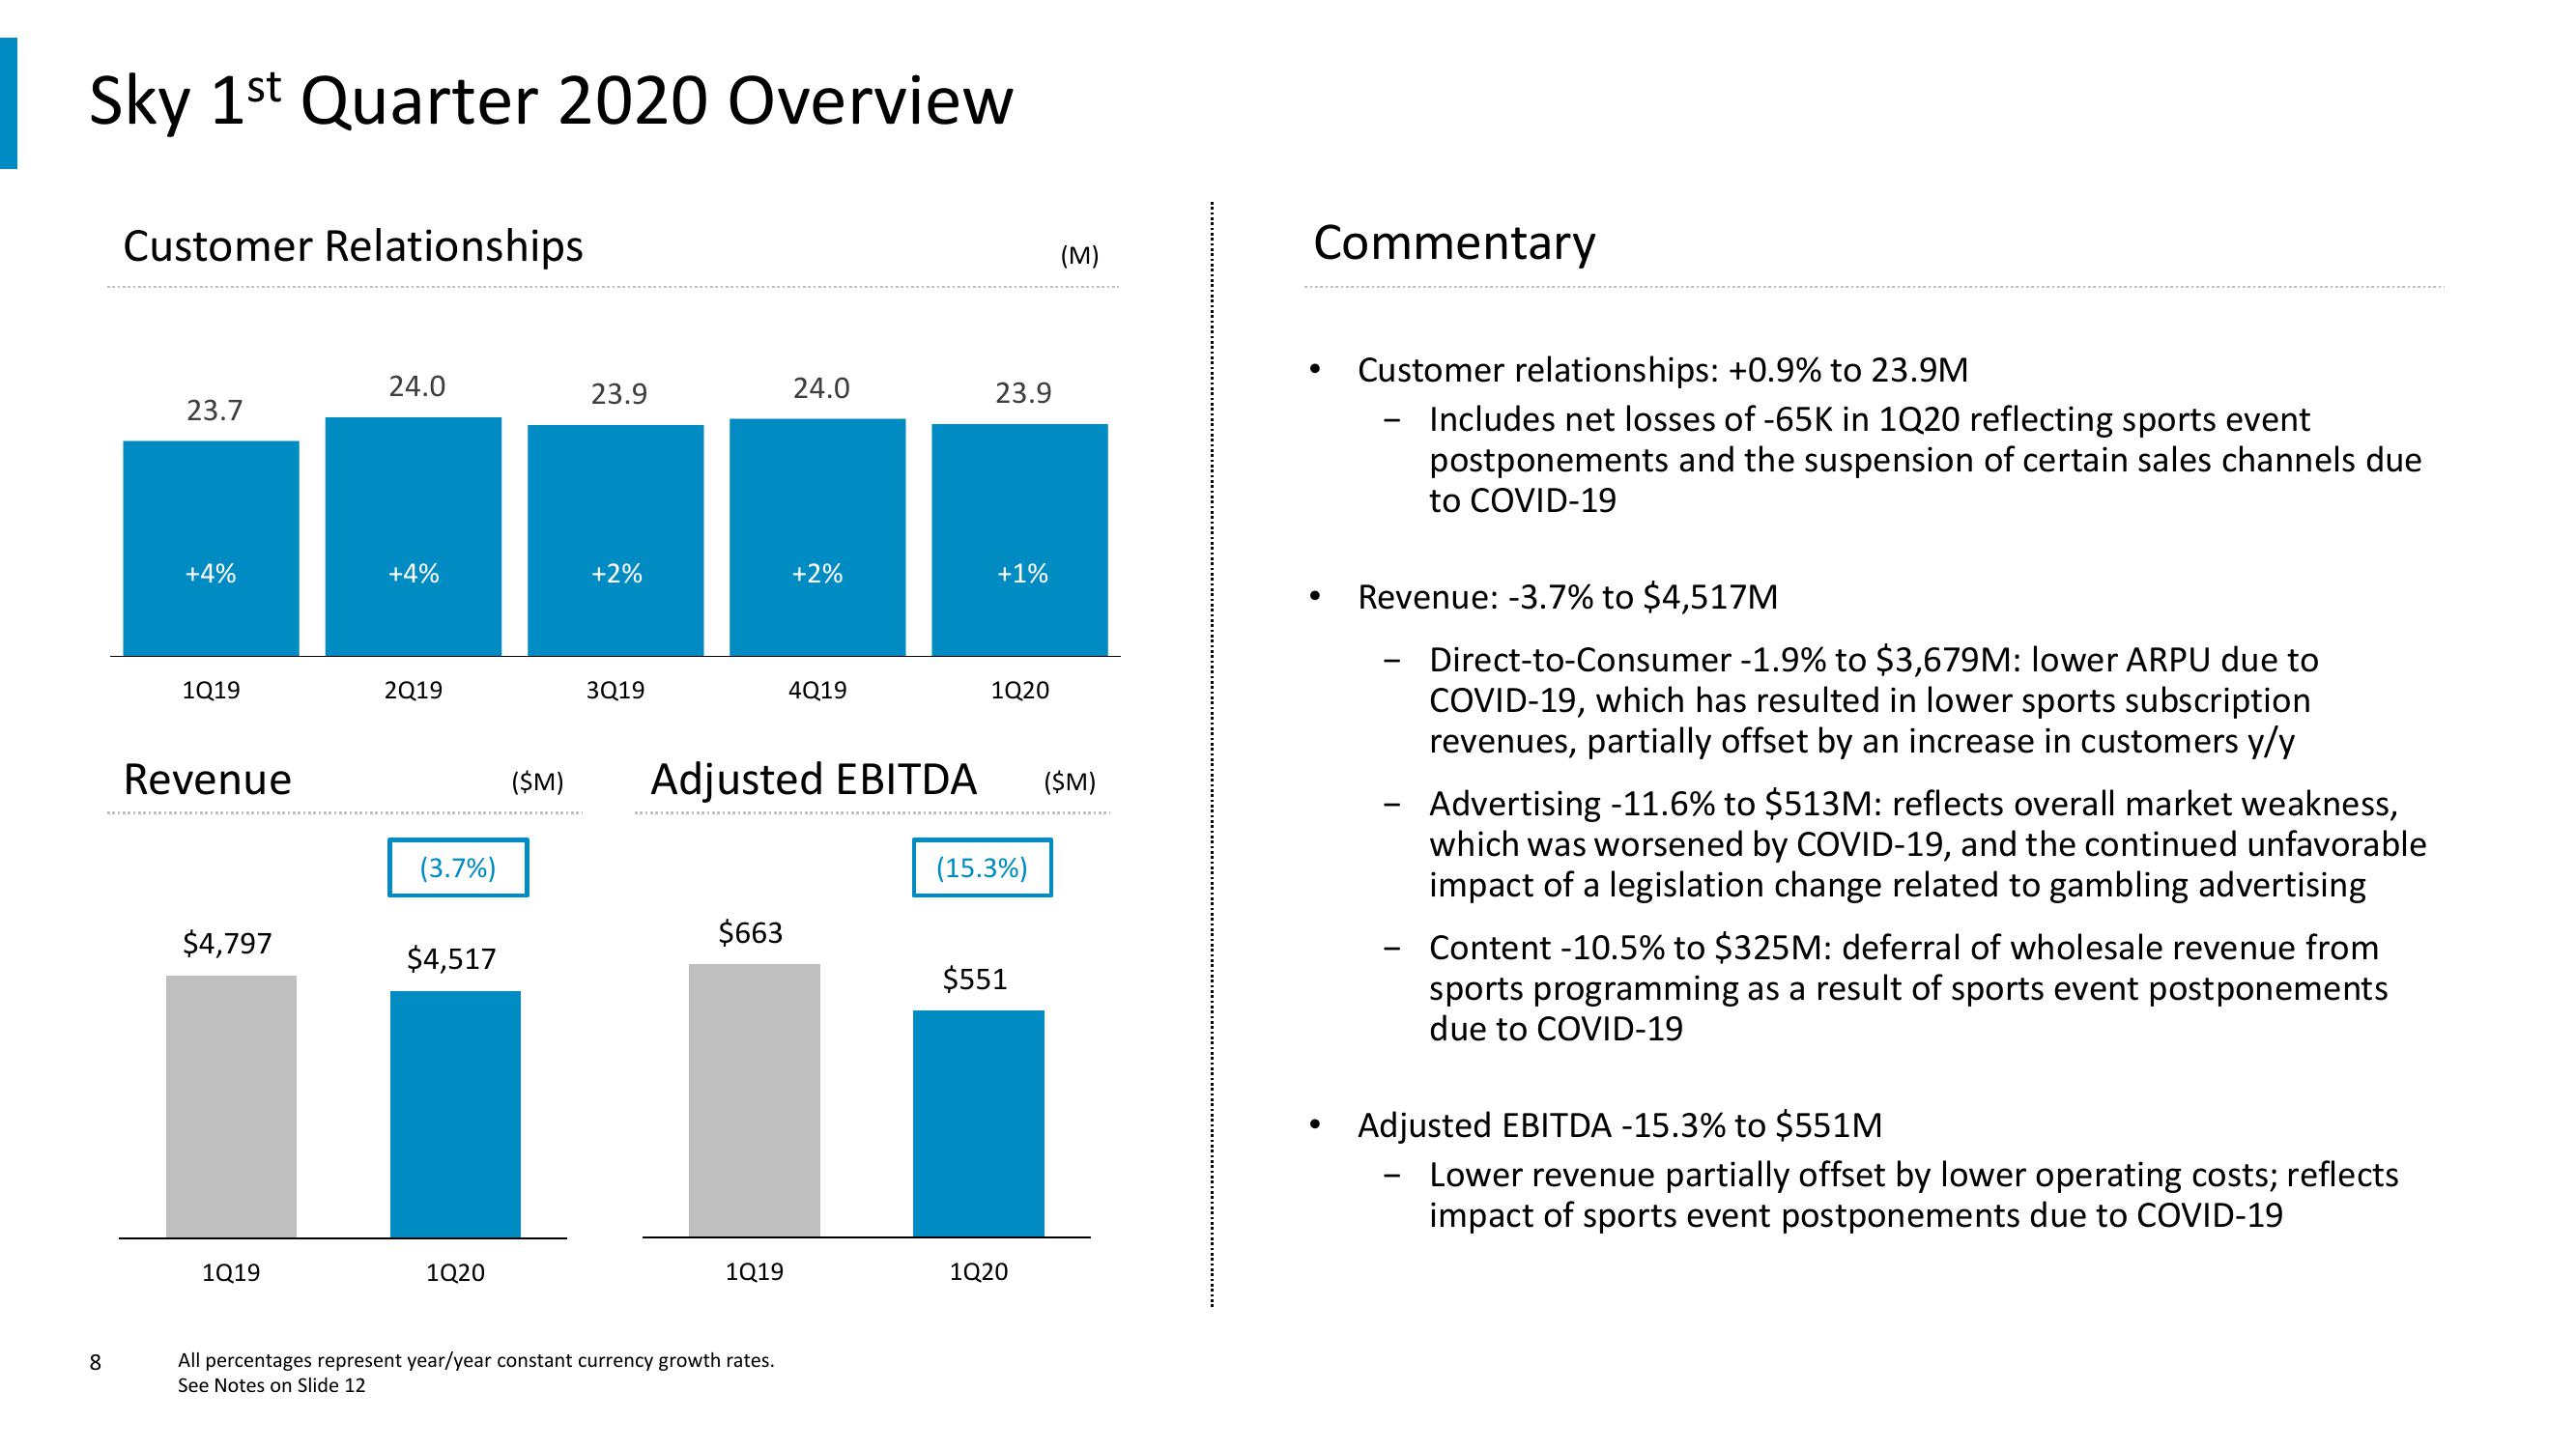
Customer relationships: +0.9% to 23.9M
Includes net losses of -65K in 1Q20 reflecting sports event
postponements and the suspension of certain sales channels due
to COVID-19
-
Revenue: -3.7% to $4,517M
Direct-to-Consumer -1.9% to $3,679M: lower ARPU due to
COVID-19, which has resulted in lower sports subscription
revenues, partially offset by an increase in customers y/y
-
Advertising -11.6% to $513M: reflects overall market weakness,
which was worsened by COVID-19, and the continued unfavorable
impact of a legislation change related to gambling advertising
Content -10.5% to $325M: deferral of wholesale revenue from
sports programming as a result of sports event postponements
due to COVID-19
Adjusted EBITDA -15.3% to $551M
Lower revenue partially offset by lower operating costs; reflects
impact of sports event postponements due to COVID-19View entire presentation