2nd Quarter 2021 Investor Presentation
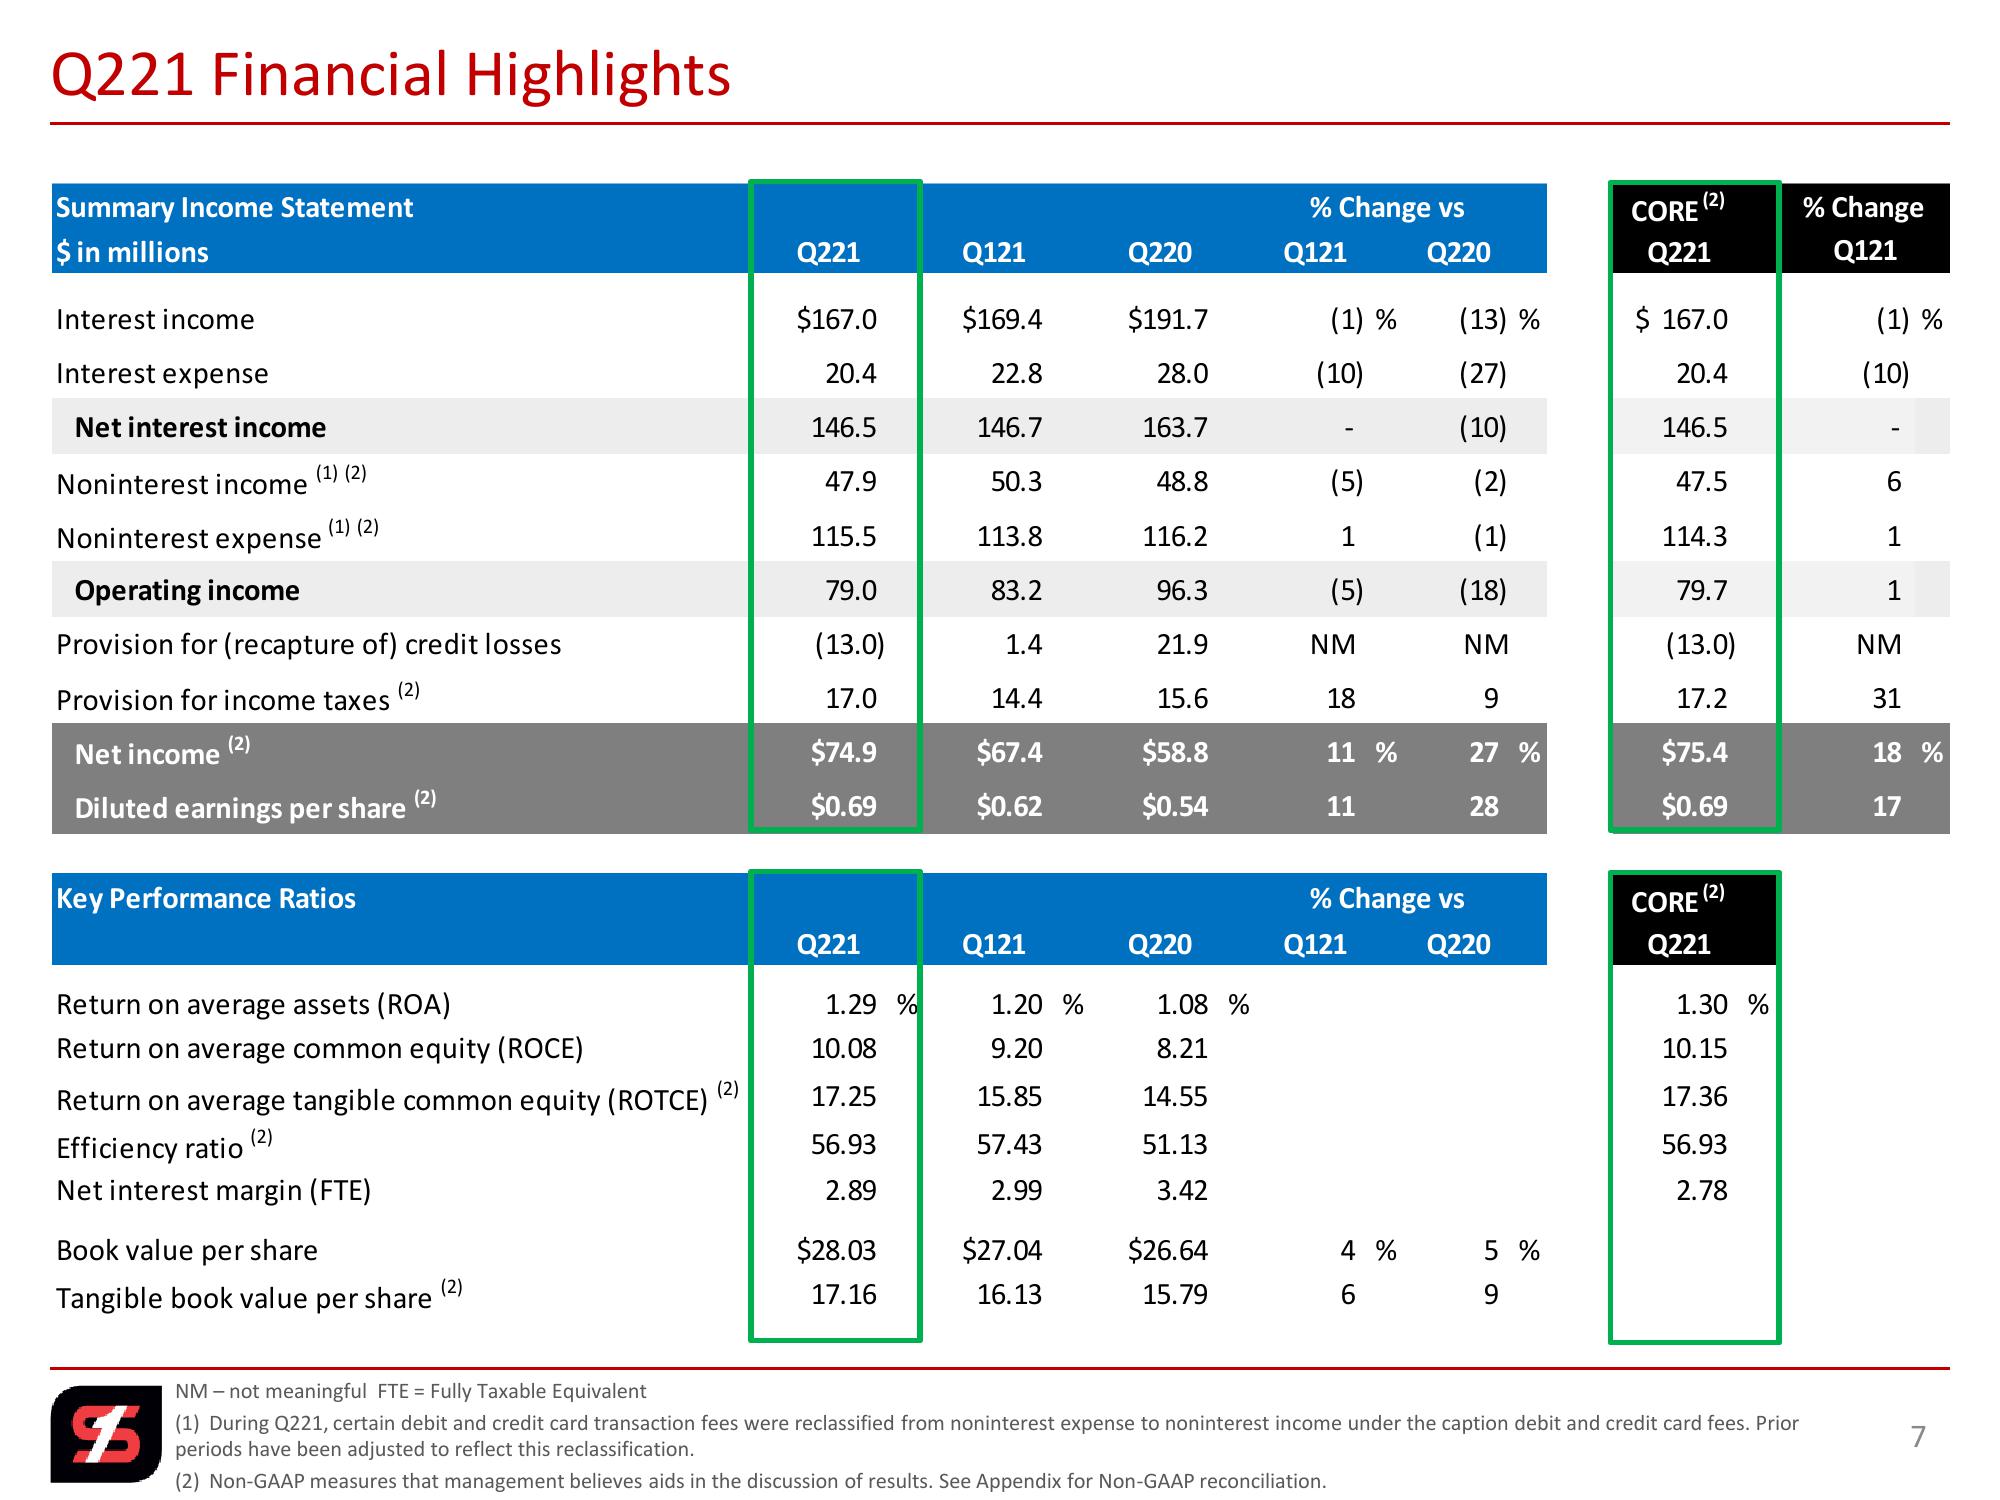
Q221 Financial Highlights
Summary Income Statement
% Change vs
(2)
CORE
% Change
$ in millions
Interest income
Q221
Q121
Q220
Q121
Q220
Q221
Q121
$167.0
$169.4
$191.7
(1) %
(13) %
$ 167.0
(1)%
Interest expense
20.4
22.8
28.0
(10)
(27)
20.4
(10)
Net interest income
146.5
146.7
163.7
(10)
146.5
(1) (2)
Noninterest income
47.9
50.3
48.8
(5)
(2)
47.5
6
Noninterest expense
(1) (2)
115.5
113.8
116.2
1
(1)
114.3
1
Operating income
79.0
83.2
96.3
(5)
(18)
79.7
1
Provision for (recapture of) credit losses
(13.0)
1.4
21.9
NM
NM
(13.0)
NM
Provision for income taxes
(2)
17.0
14.4
15.6
18
9
17.2
31
31
(2)
Net income
$74.9
$67.4
$58.8
11 %
27 %
$75.4
18 %
(2)
Diluted earnings per share
$0.69
$0.62
$0.54
11
28
$0.69
17
Key Performance Ratios
% Change vs
Q221
Q121
Q220
Q121
Q220
CORE (2)
Q221
Return on average assets (ROA)
1.29 %
1.20 %
1.08 %
1.30 %
Return on average common equity (ROCE)
10.08
9.20
8.21
10.15
Efficiency ratio
(2)
Book value per share
Return on average tangible common equity (ROTCE)
Net interest margin (FTE)
Tangible book value per share
(2)
17.25
15.85
14.55
17.36
56.93
57.43
51.13
56.93
2.89
2.99
3.42
2.78
(2)
$28.03
17.16
$27.04
$26.64
16.13
15.79
46
4 %
59
5 %
$
NM - not meaningful FTE = Fully Taxable Equivalent
(1) During Q221, certain debit and credit card transaction fees were reclassified from noninterest expense to noninterest income under the caption debit and credit card fees. Prior
periods have been adjusted to reflect this reclassification.
(2) Non-GAAP measures that management believes aids in the discussion of results. See Appendix for Non-GAAP reconciliation.
7View entire presentation