Asos Results Presentation Deck
◄ © 2023 asos
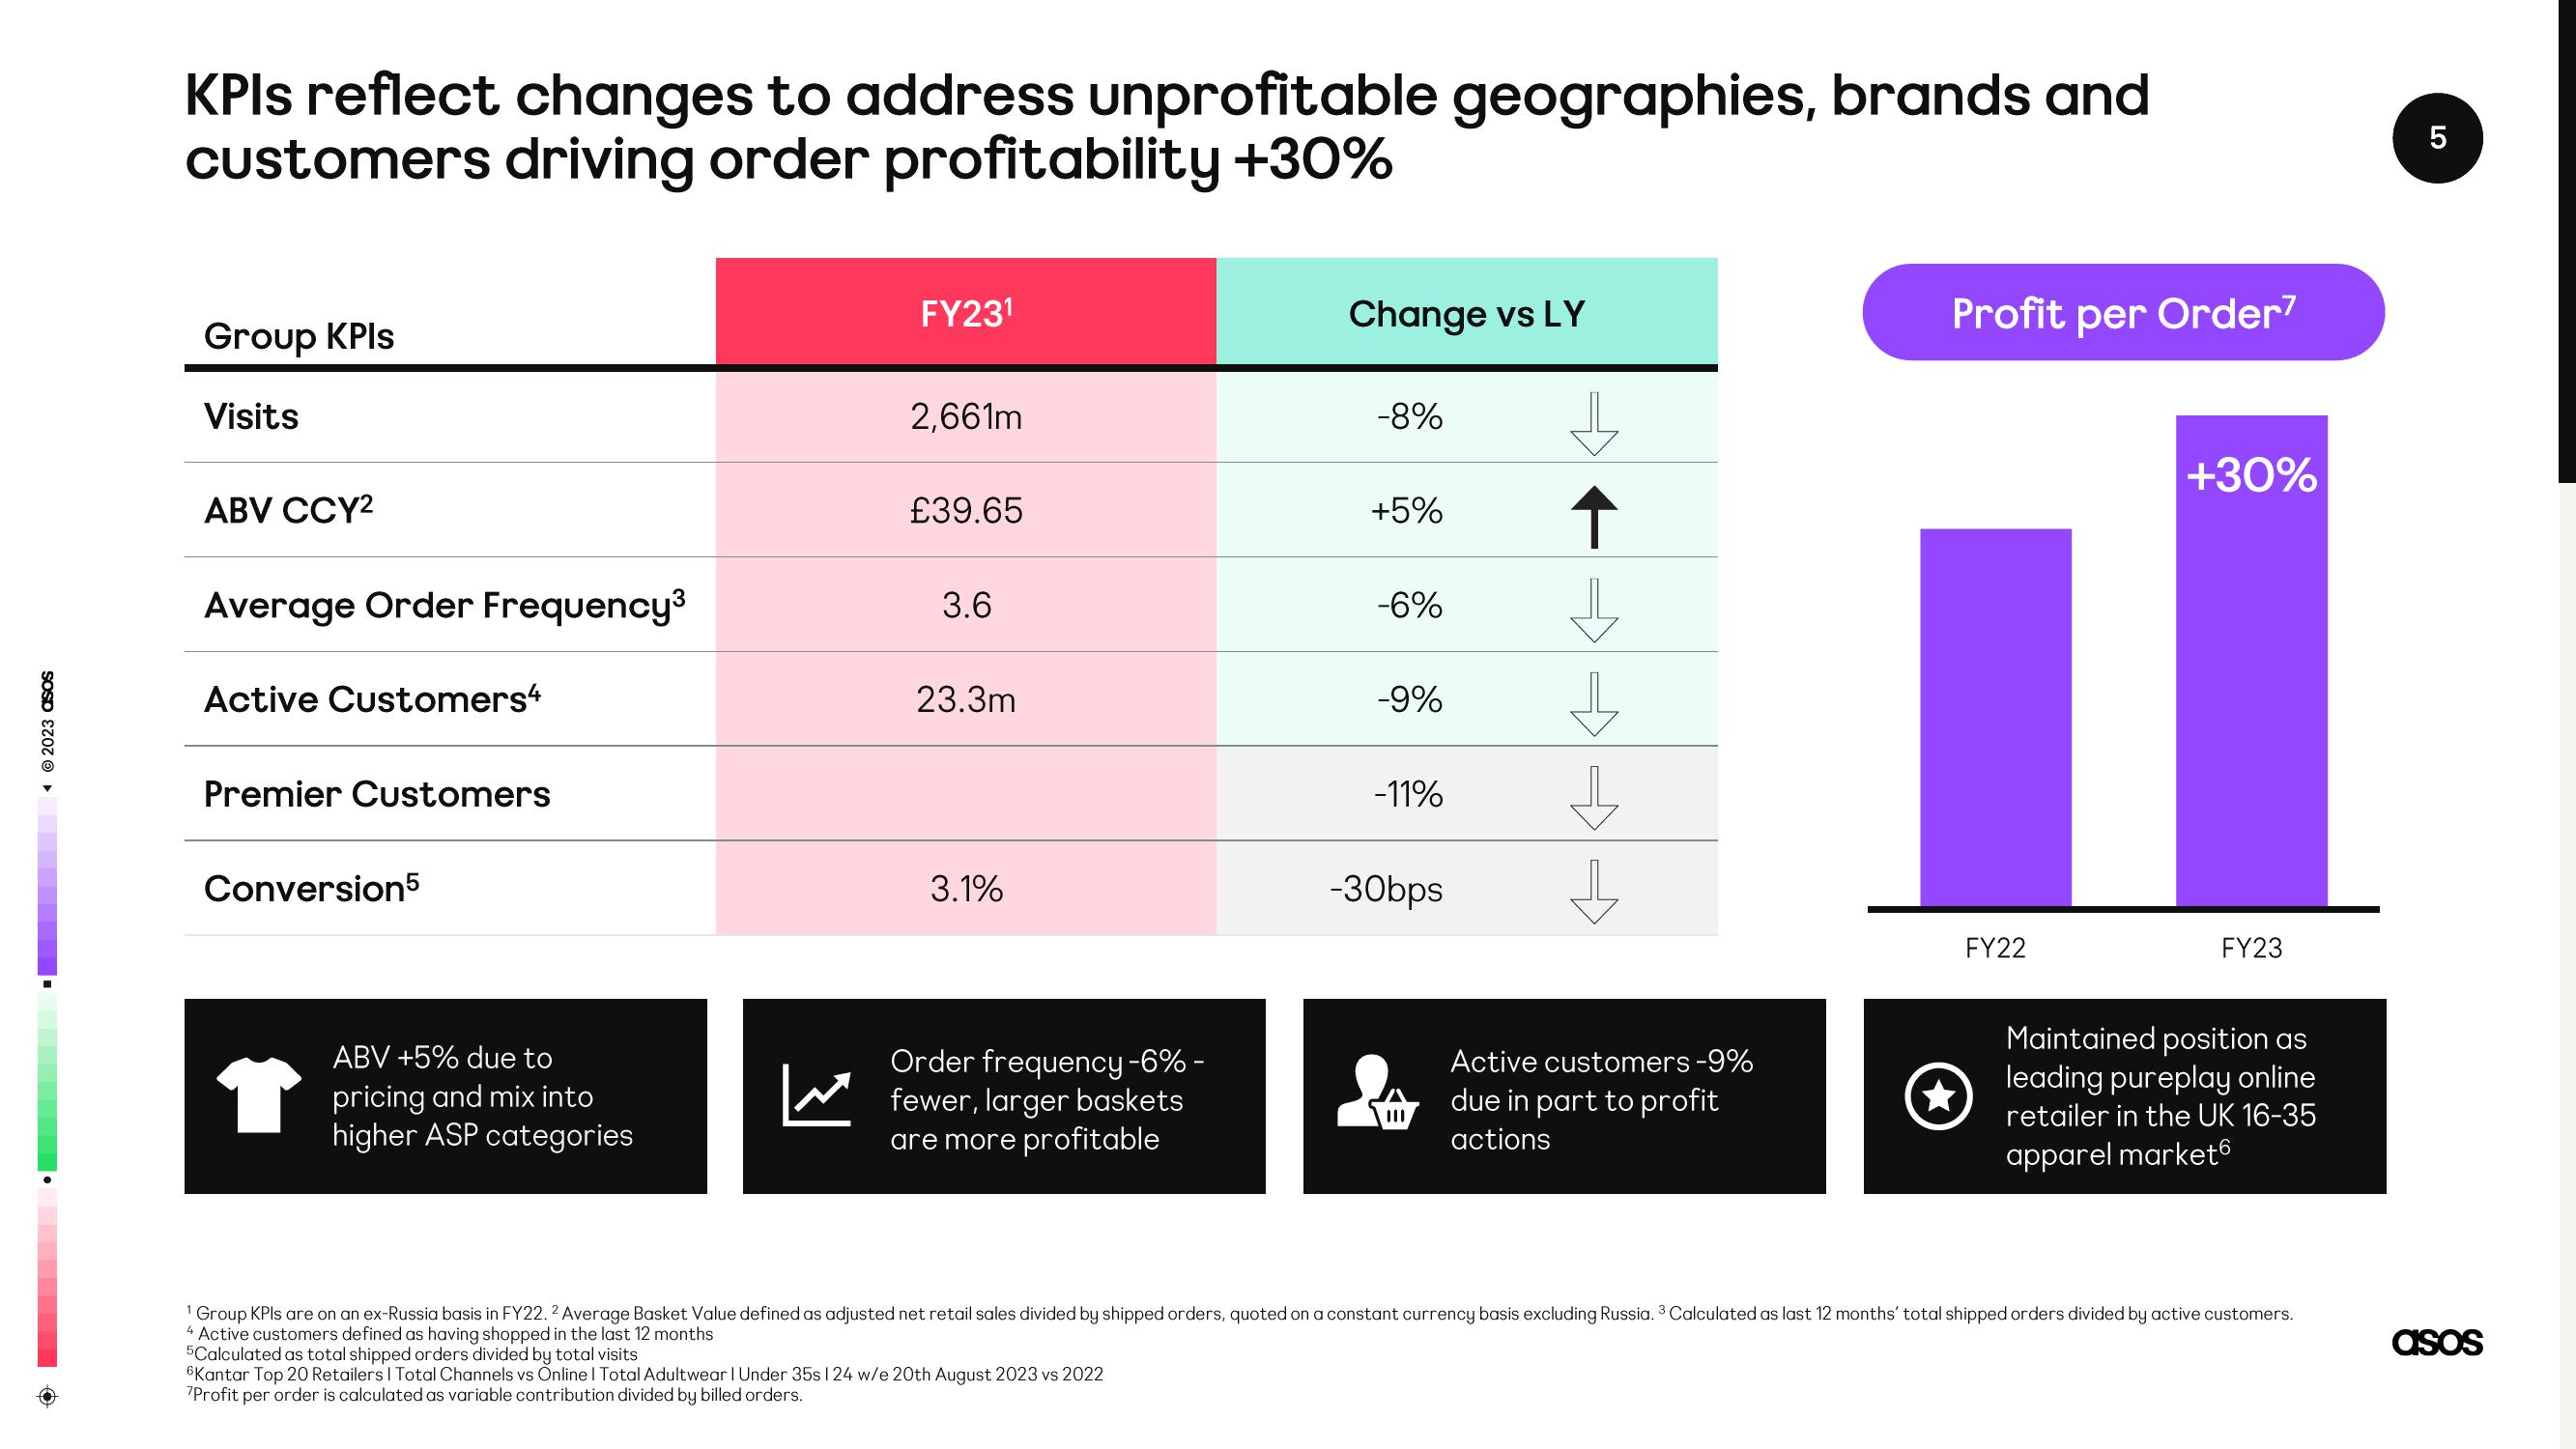
KPIs reflect changes to address unprofitable geographies, brands and
customers driving order profitability +30%
Group KPIs
Visits
ABV CCY²
Average Order Frequency³
Active Customers4
Premier Customers
Conversion5
ABV +5% due to
pricing and mix into
higher ASP categories
FY23¹
2,661m
£39.65
3.6
23.3m
3.1%
Order frequency -6% -
fewer, larger baskets
are more profitable
Change vs LY
6Kantar Top 20 Retailers I Total Channels vs Online I Total Adultwear | Under 35s 124 w/e 20th August 2023 vs 2022
7Profit per order is calculated as variable contribution divided by billed orders.
-8%
+5%
-6%
-9%
-11%
-30bps
↑
↓
↓
↓
Active customers -9%
due in part to profit
actions
Profit per Order?
FY22
+30%
FY23
Maintained position as
leading pureplay online
retailer in the UK 16-35
apparel market
¹ Group KPIs are on an ex-Russia basis in FY22. 2 Average Basket Value defined as adjusted net retail sales divided by shipped orders, quoted on a constant currency basis excluding Russia. ³ Calculated as last 12 months' total shipped orders divided by active customers.
4 Active customers defined as having shopped in the last 12 months
5Calculated as total shipped orders divided by total visits
LO
5
asosView entire presentation