ILPT Q2 2023 Financial Results
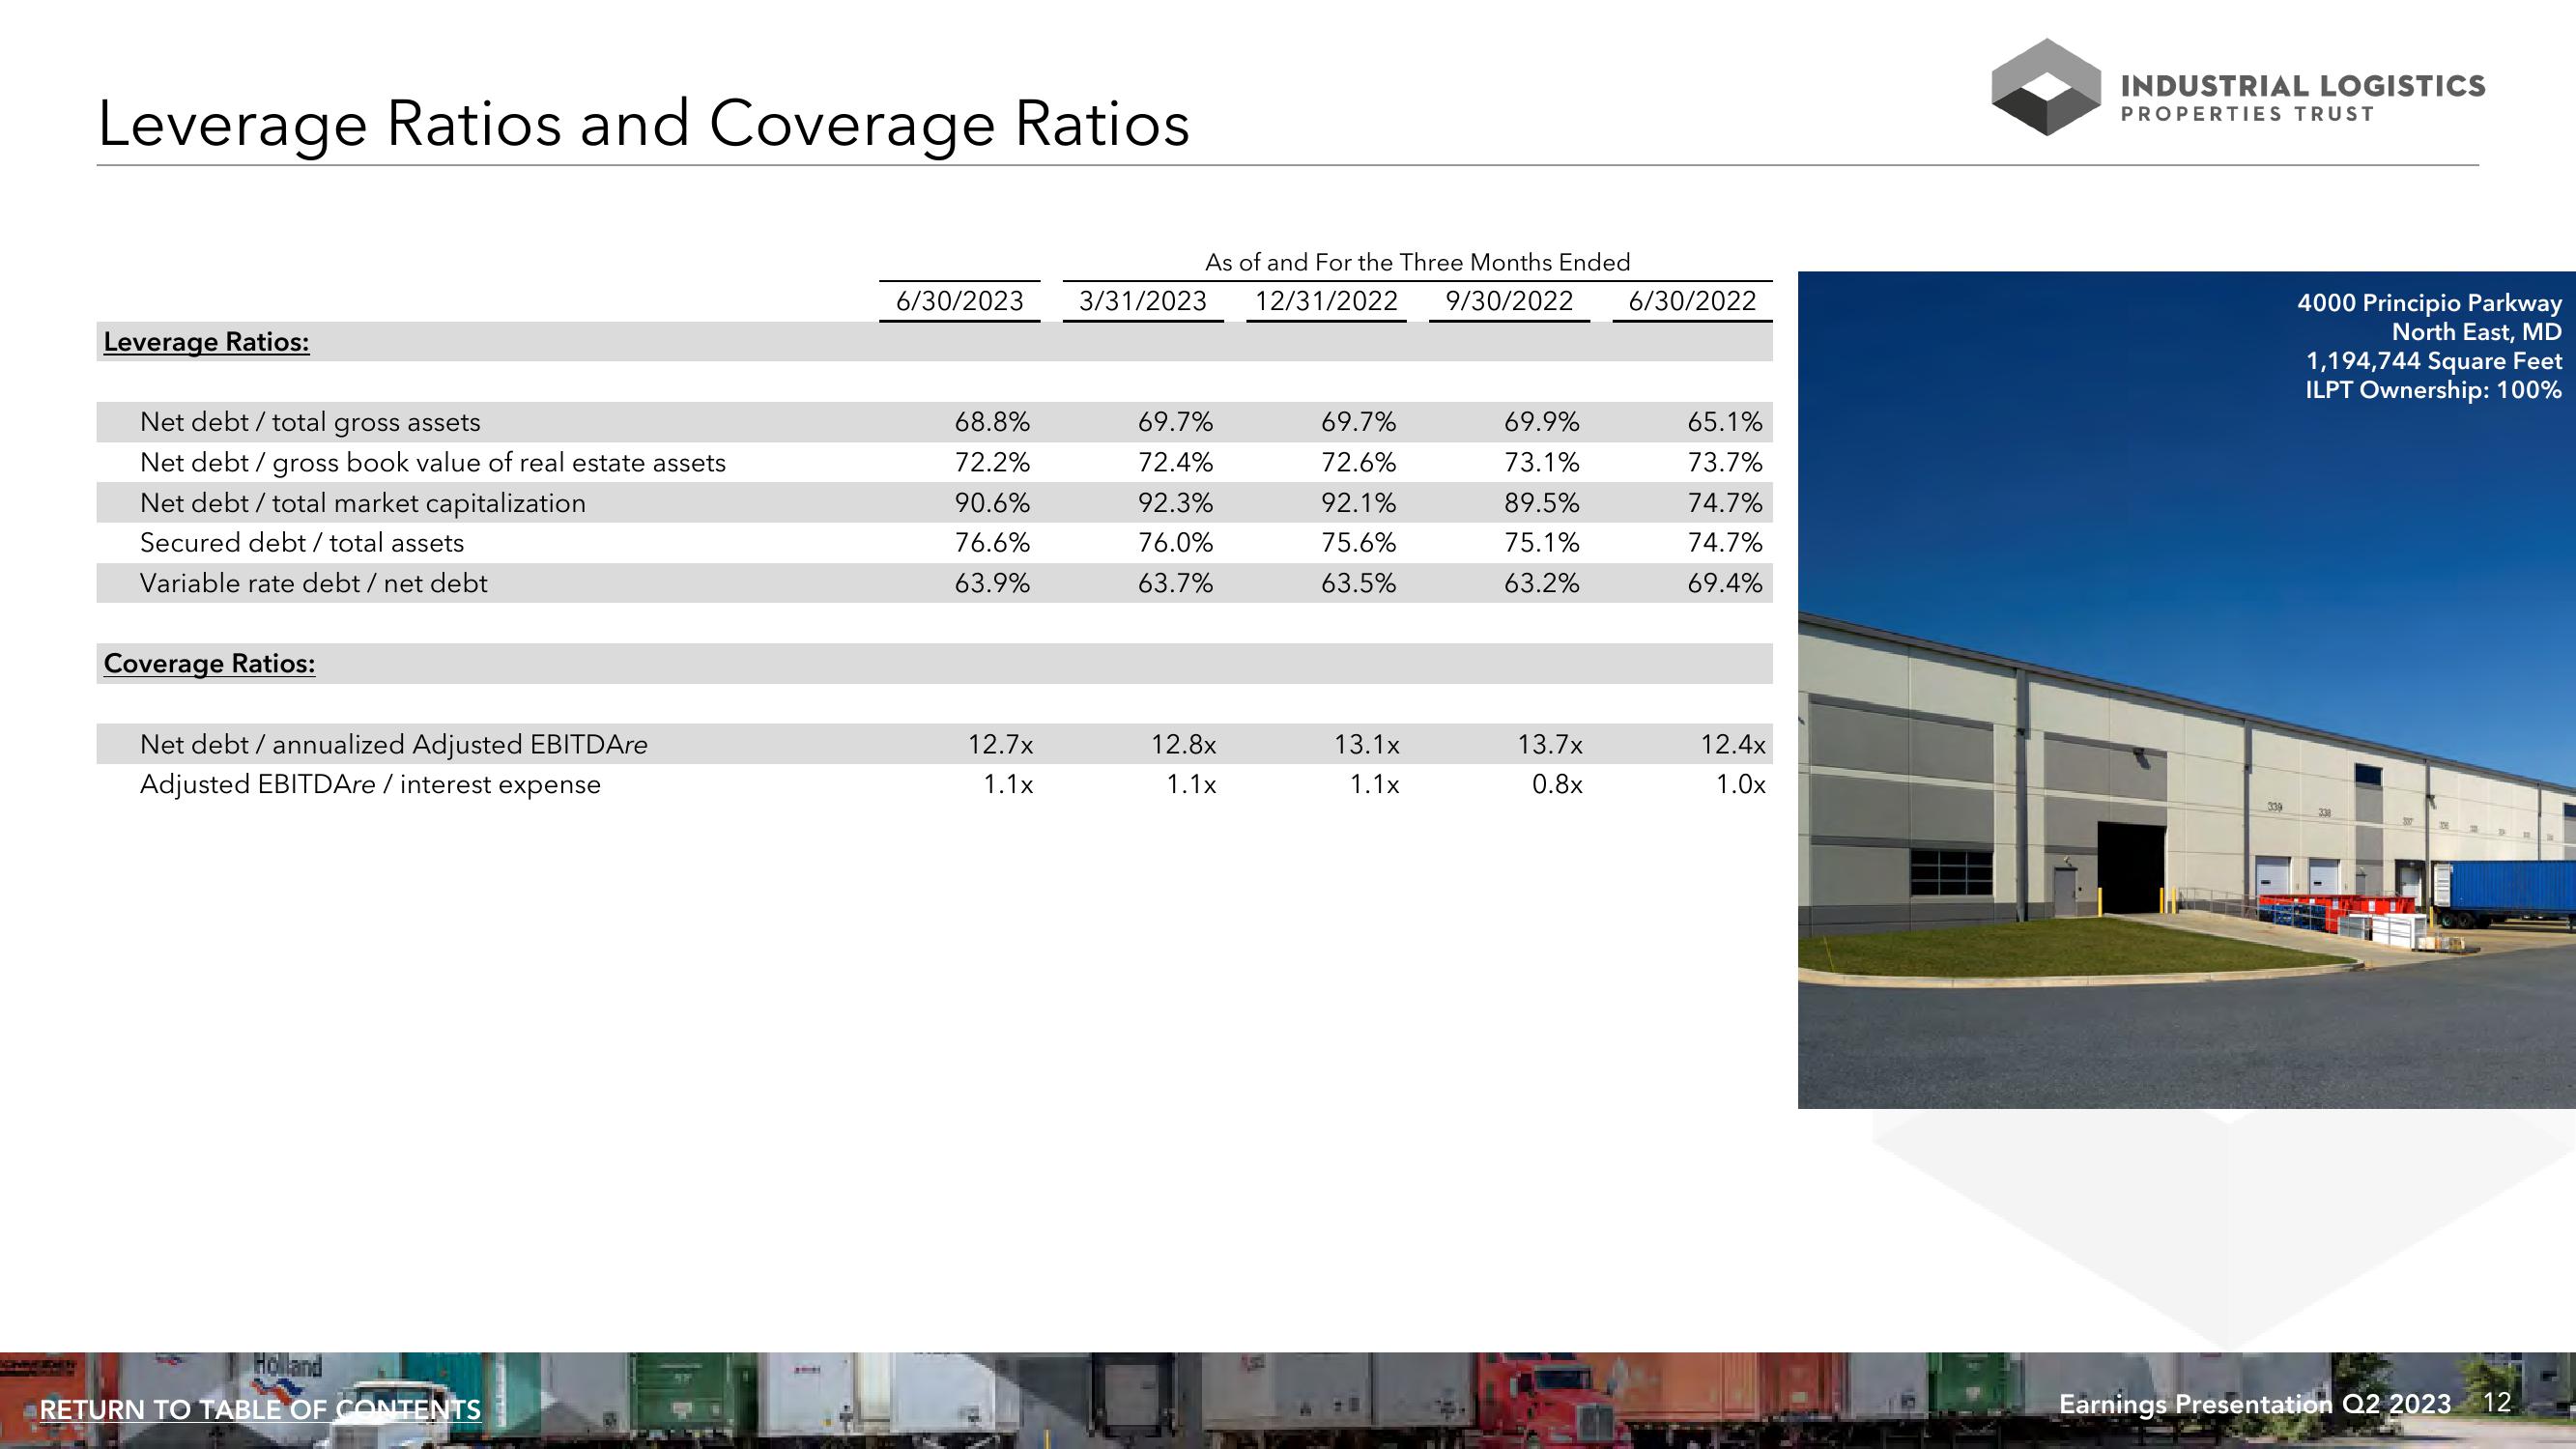
Leverage Ratios and Coverage Ratios
Leverage Ratios:
Net debt / total gross assets
Net debt / gross book value of real estate assets
Net debt / total market capitalization
Secured debt / total assets
Variable rate debt / net debt
Coverage Ratios:
Net debt / annualized Adjusted EBITDAre
Adjusted EBITDAre / interest expense
Holland
RETURN TO TABLE OF CONTENTS
As of and For the Three Months Ended
6/30/2023 3/31/2023 12/31/2022 9/30/2022
68.8%
72.2%
90.6%
76.6%
63.9%
12.7x
1.1x
69.7%
72.4%
92.3%
76.0%
63.7%
12.8x
1.1x
69.7%
72.6%
92.1%
75.6%
63.5%
13.1x
1.1x
69.9%
73.1%
89.5%
75.1%
63.2%
13.7x
0.8x
6/30/2022
65.1%
73.7%
74.7%
74.7%
69.4%
12.4x
1.0x
INDUSTRIAL LOGISTICS
PROPERTIES TRUST
339
4000 Principio Parkway
North East, MD
1,194,744 Square Feet
ILPT Ownership: 100%
Earnings Presentation Q2 2023 12View entire presentation