Bed Bath & Beyond Results Presentation Deck slide image

Bed Bath & Beyond Results Presentation Deck

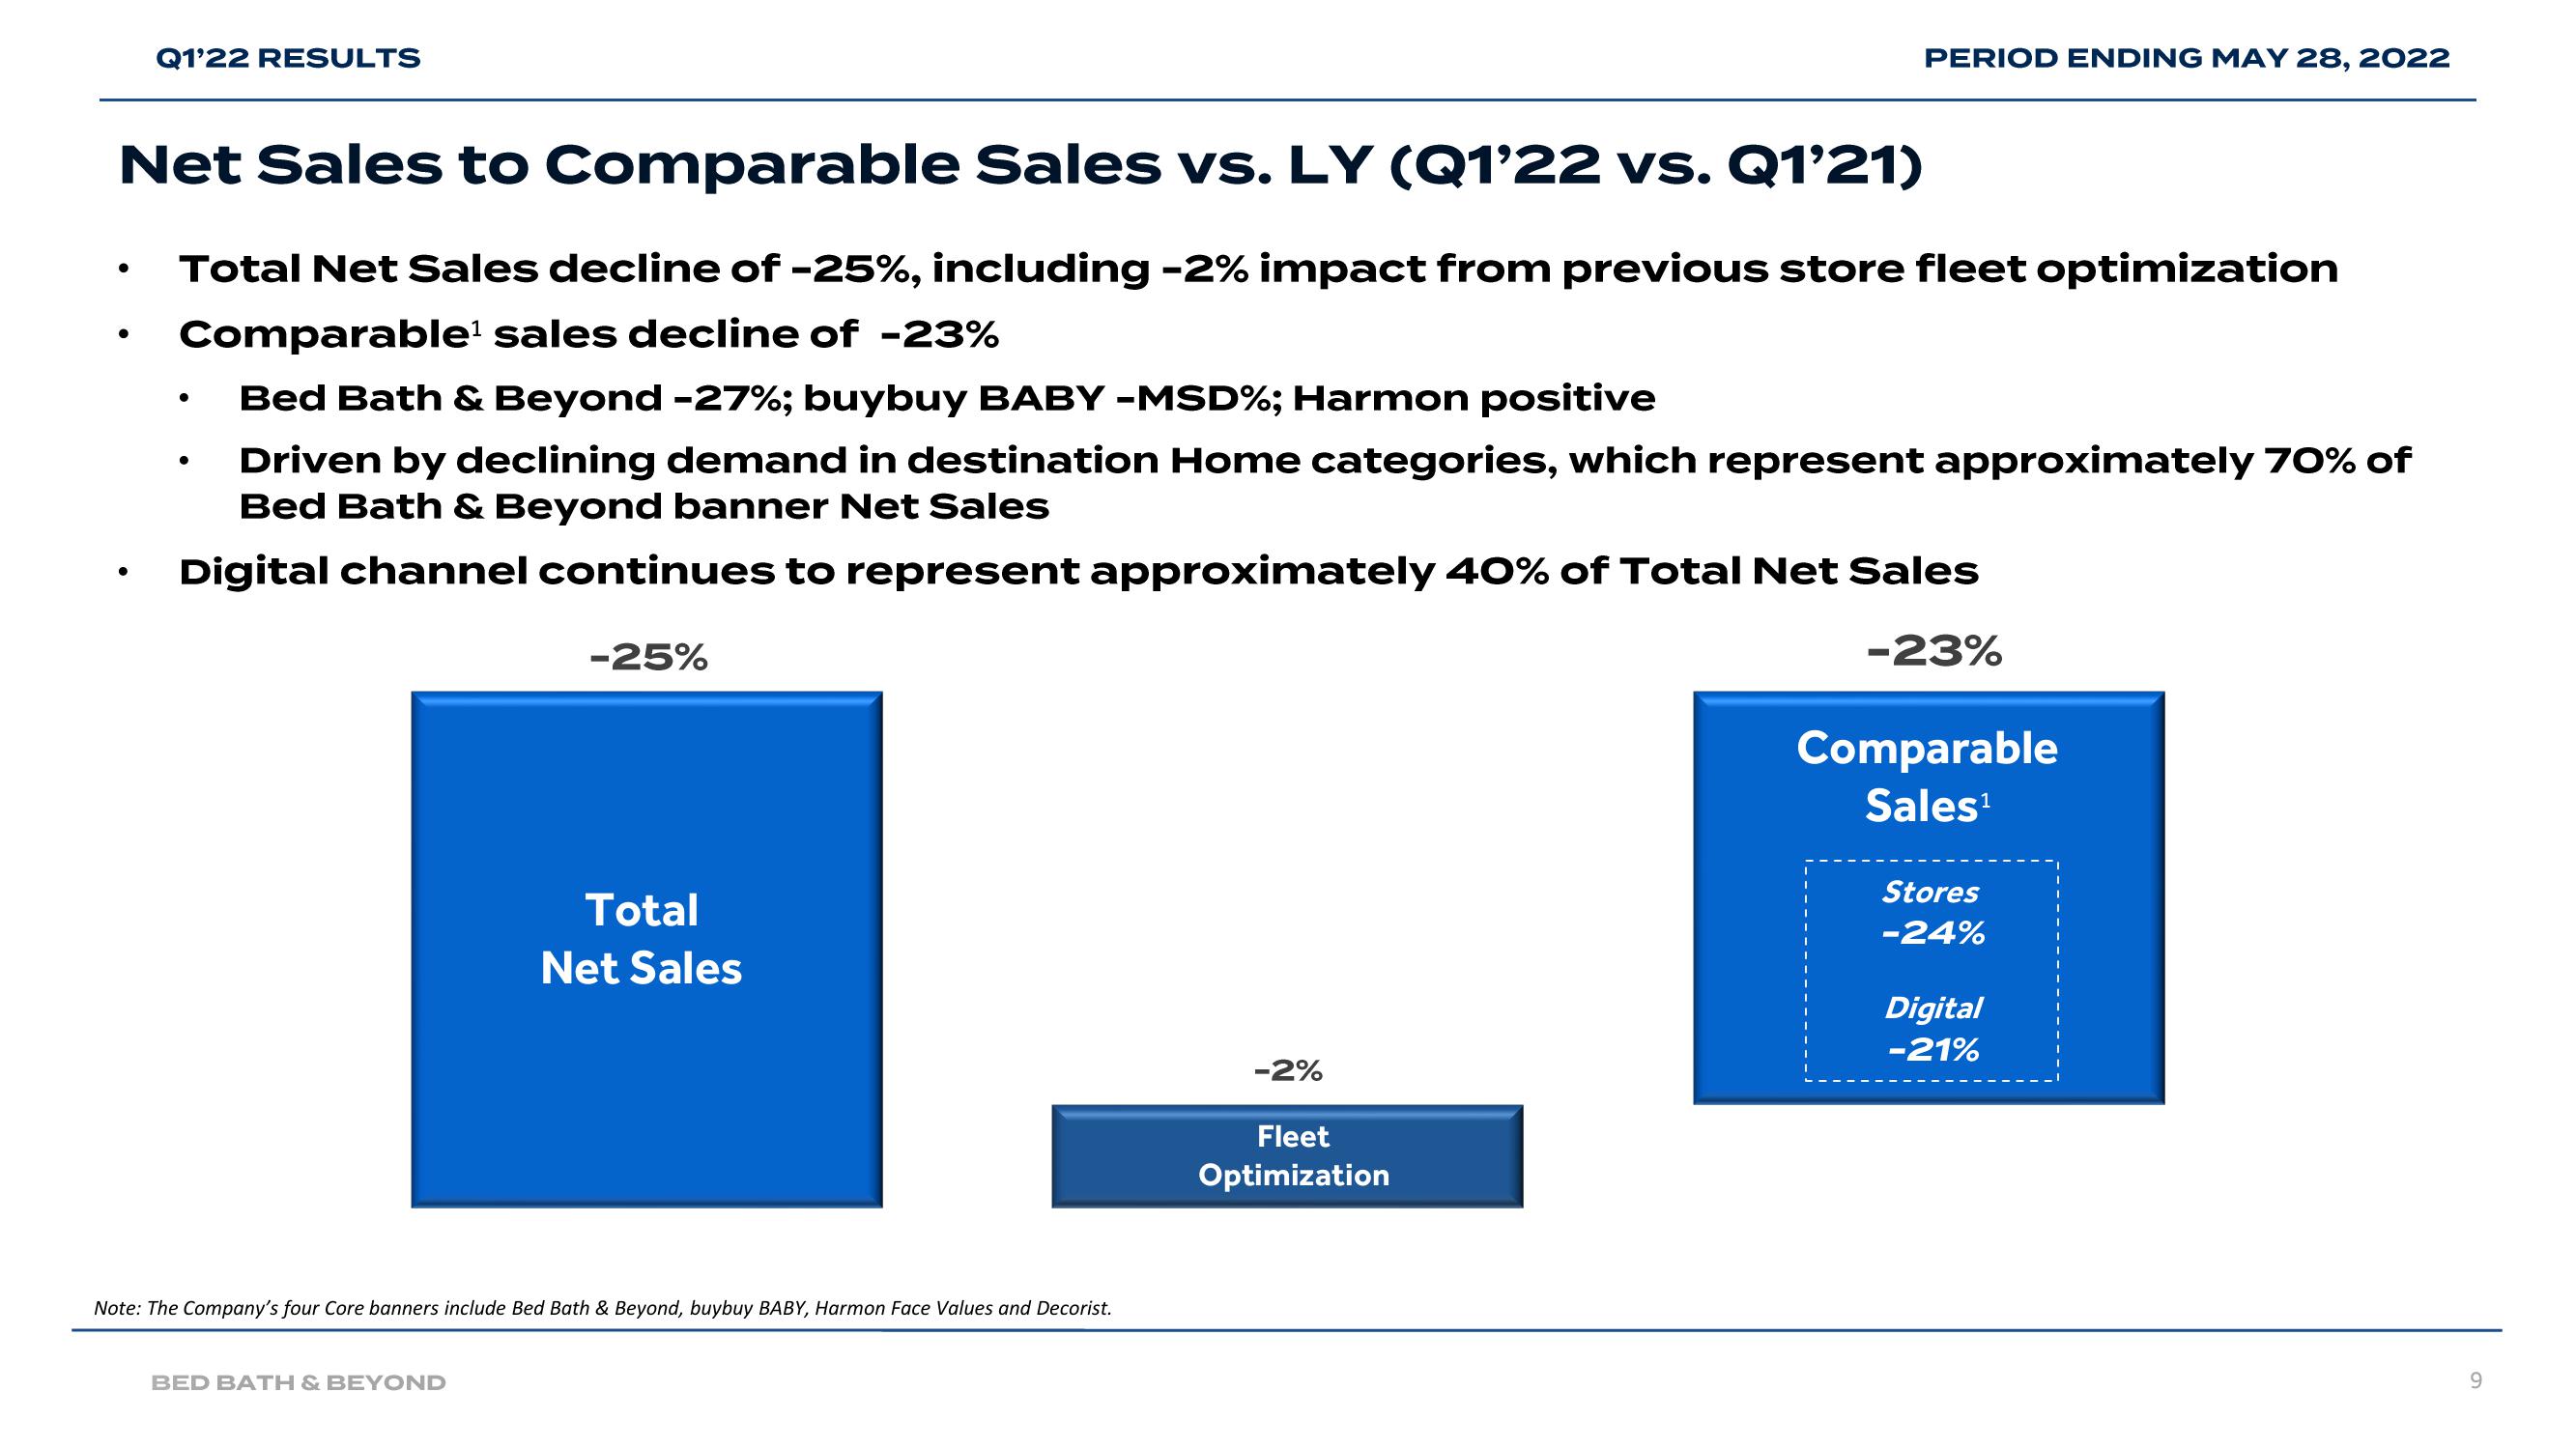
Q1'22 RESULTS ● Net Sales to Comparable Sales vs. LY (Q1'22 vs. Q1'21) Total Net Sales decline of -25%, including -2% impact from previous store fleet optimization Comparable¹ sales decline of -23% Bed Bath & Beyond -27%; buybuy BABY -MSD%; Harmon positive Driven by declining demand in destination Home categories, which represent approximately 70% of Bed Bath & Beyond banner Net Sales Digital channel continues to represent approximately 40% of Total Net Sales -25% -23% ● Total Net Sales Note: The Company's four Core banners include Bed Bath & Beyond, buybuy BABY, Harmon Face Values and Decorist. BED BATH & BEYOND PERIOD ENDING MAY 28, 2022 -2% Fleet Optimization Comparable Sales¹ Stores -24% Digital -21% 9
View entire presentation