Kering Investor Presentation Deck
In €m
Gucci
Saint Laurent
Bottega Veneta
Other Houses
Total Houses
Corporate & other
Kering total
In €m
Gucci
Saint Laurent
Bottega Veneta
Other Houses
Total Houses
Corporate & other
Kering total
Q3 21
Revenue
2,181.8
652.9
363.4
843.7
4,041.8
146.0
4,187.8
9M 21
Revenue
6,661.1
1,698.4
1,071.0
2,319.3
11,749.8
485.2
12,235.0
Reported
+4.5%
+27.8%
+9.3%
+26.1%
+12.3%
+24.1%
+12.6%
Change (%)
Reported
+29.1%
+42.5%
+28.2%
+46.0%
+33.9%
+51.4%
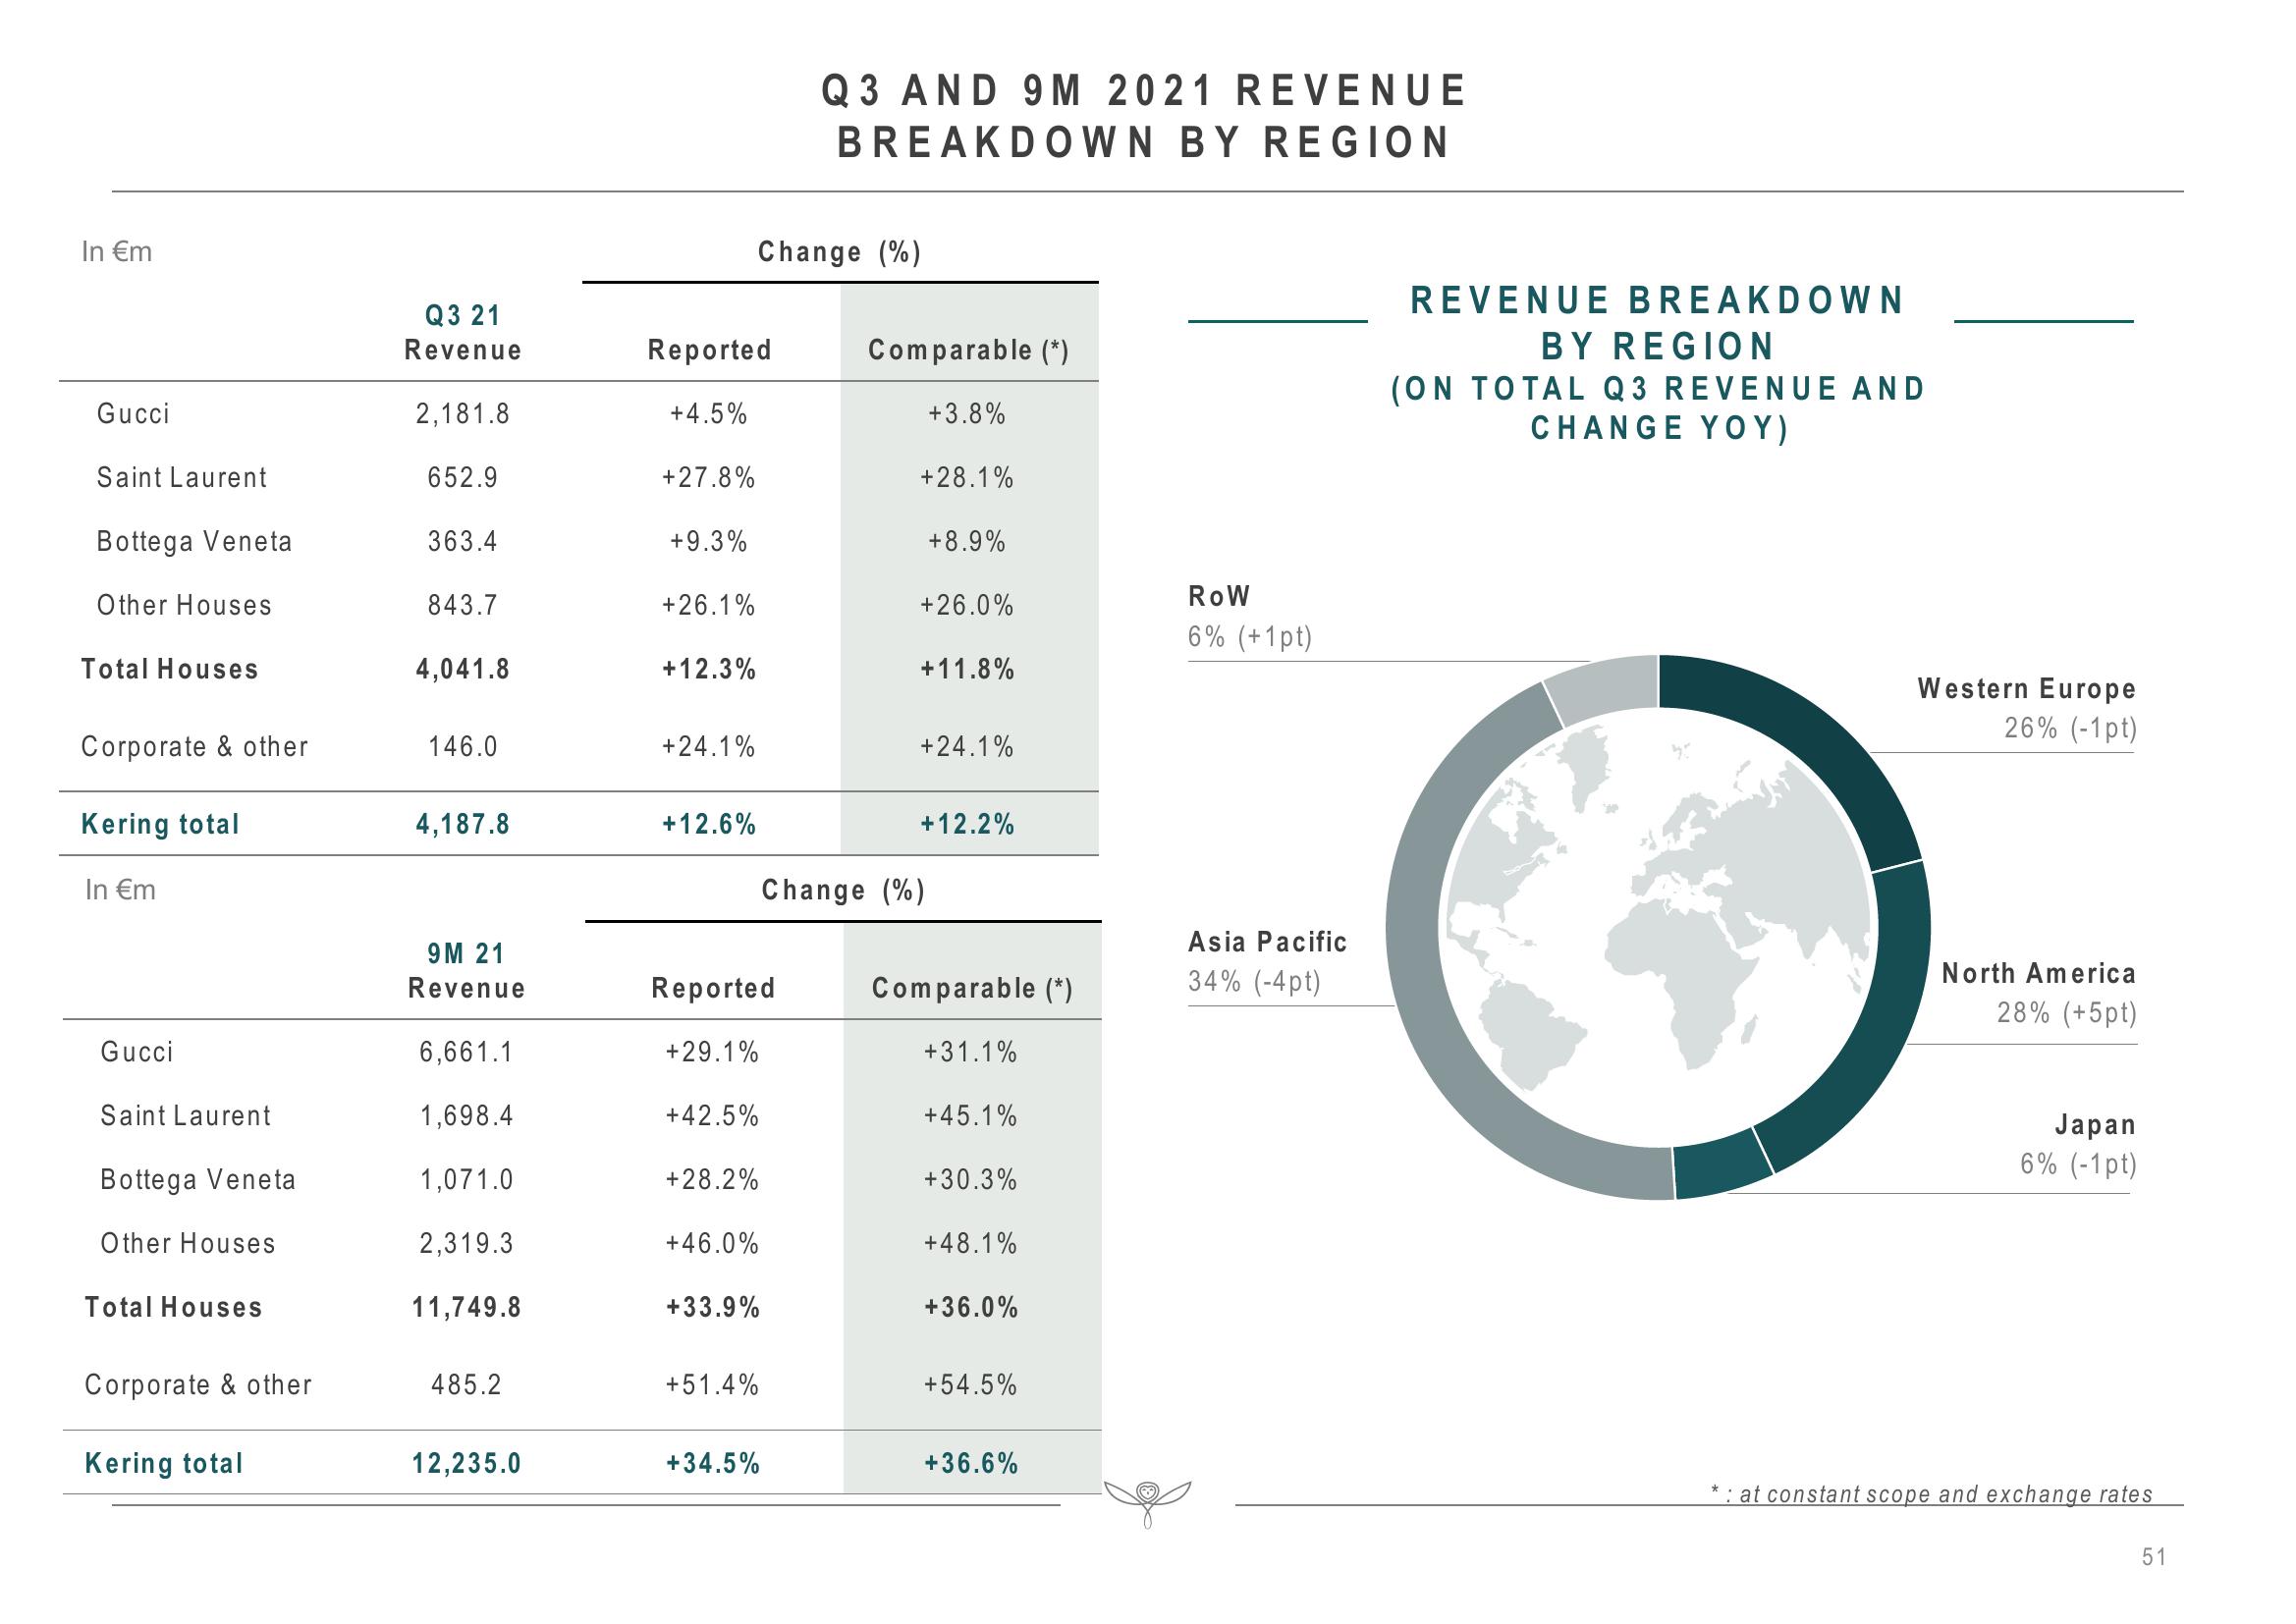
Q3 AND 9M 2021 REVENUE
BREAKDOWN BY REGION
+34.5%
Comparable (*)
+3.8%
+28.1%
+8.9%
+26.0%
+11.8%
+24.1%
+12.2%
Change (%)
Comparable (*)
+31.1%
+45.1%
+30.3%
+48.1%
+36.0%
+54.5%
+36.6%
ROW
6% (+1 pt)
Asia Pacific
34% (-4pt)
REVENUE BREAKDOWN
BY REGION
(ON TOTAL Q3 REVENUE AND
CHANGE YOY)
Western Europe
26% (-1pt)
North America
28% (+5pt)
Japan
6% (-1 pt)
: at constant scope and exchange rates
51View entire presentation