Wix Investor Presentation Deck
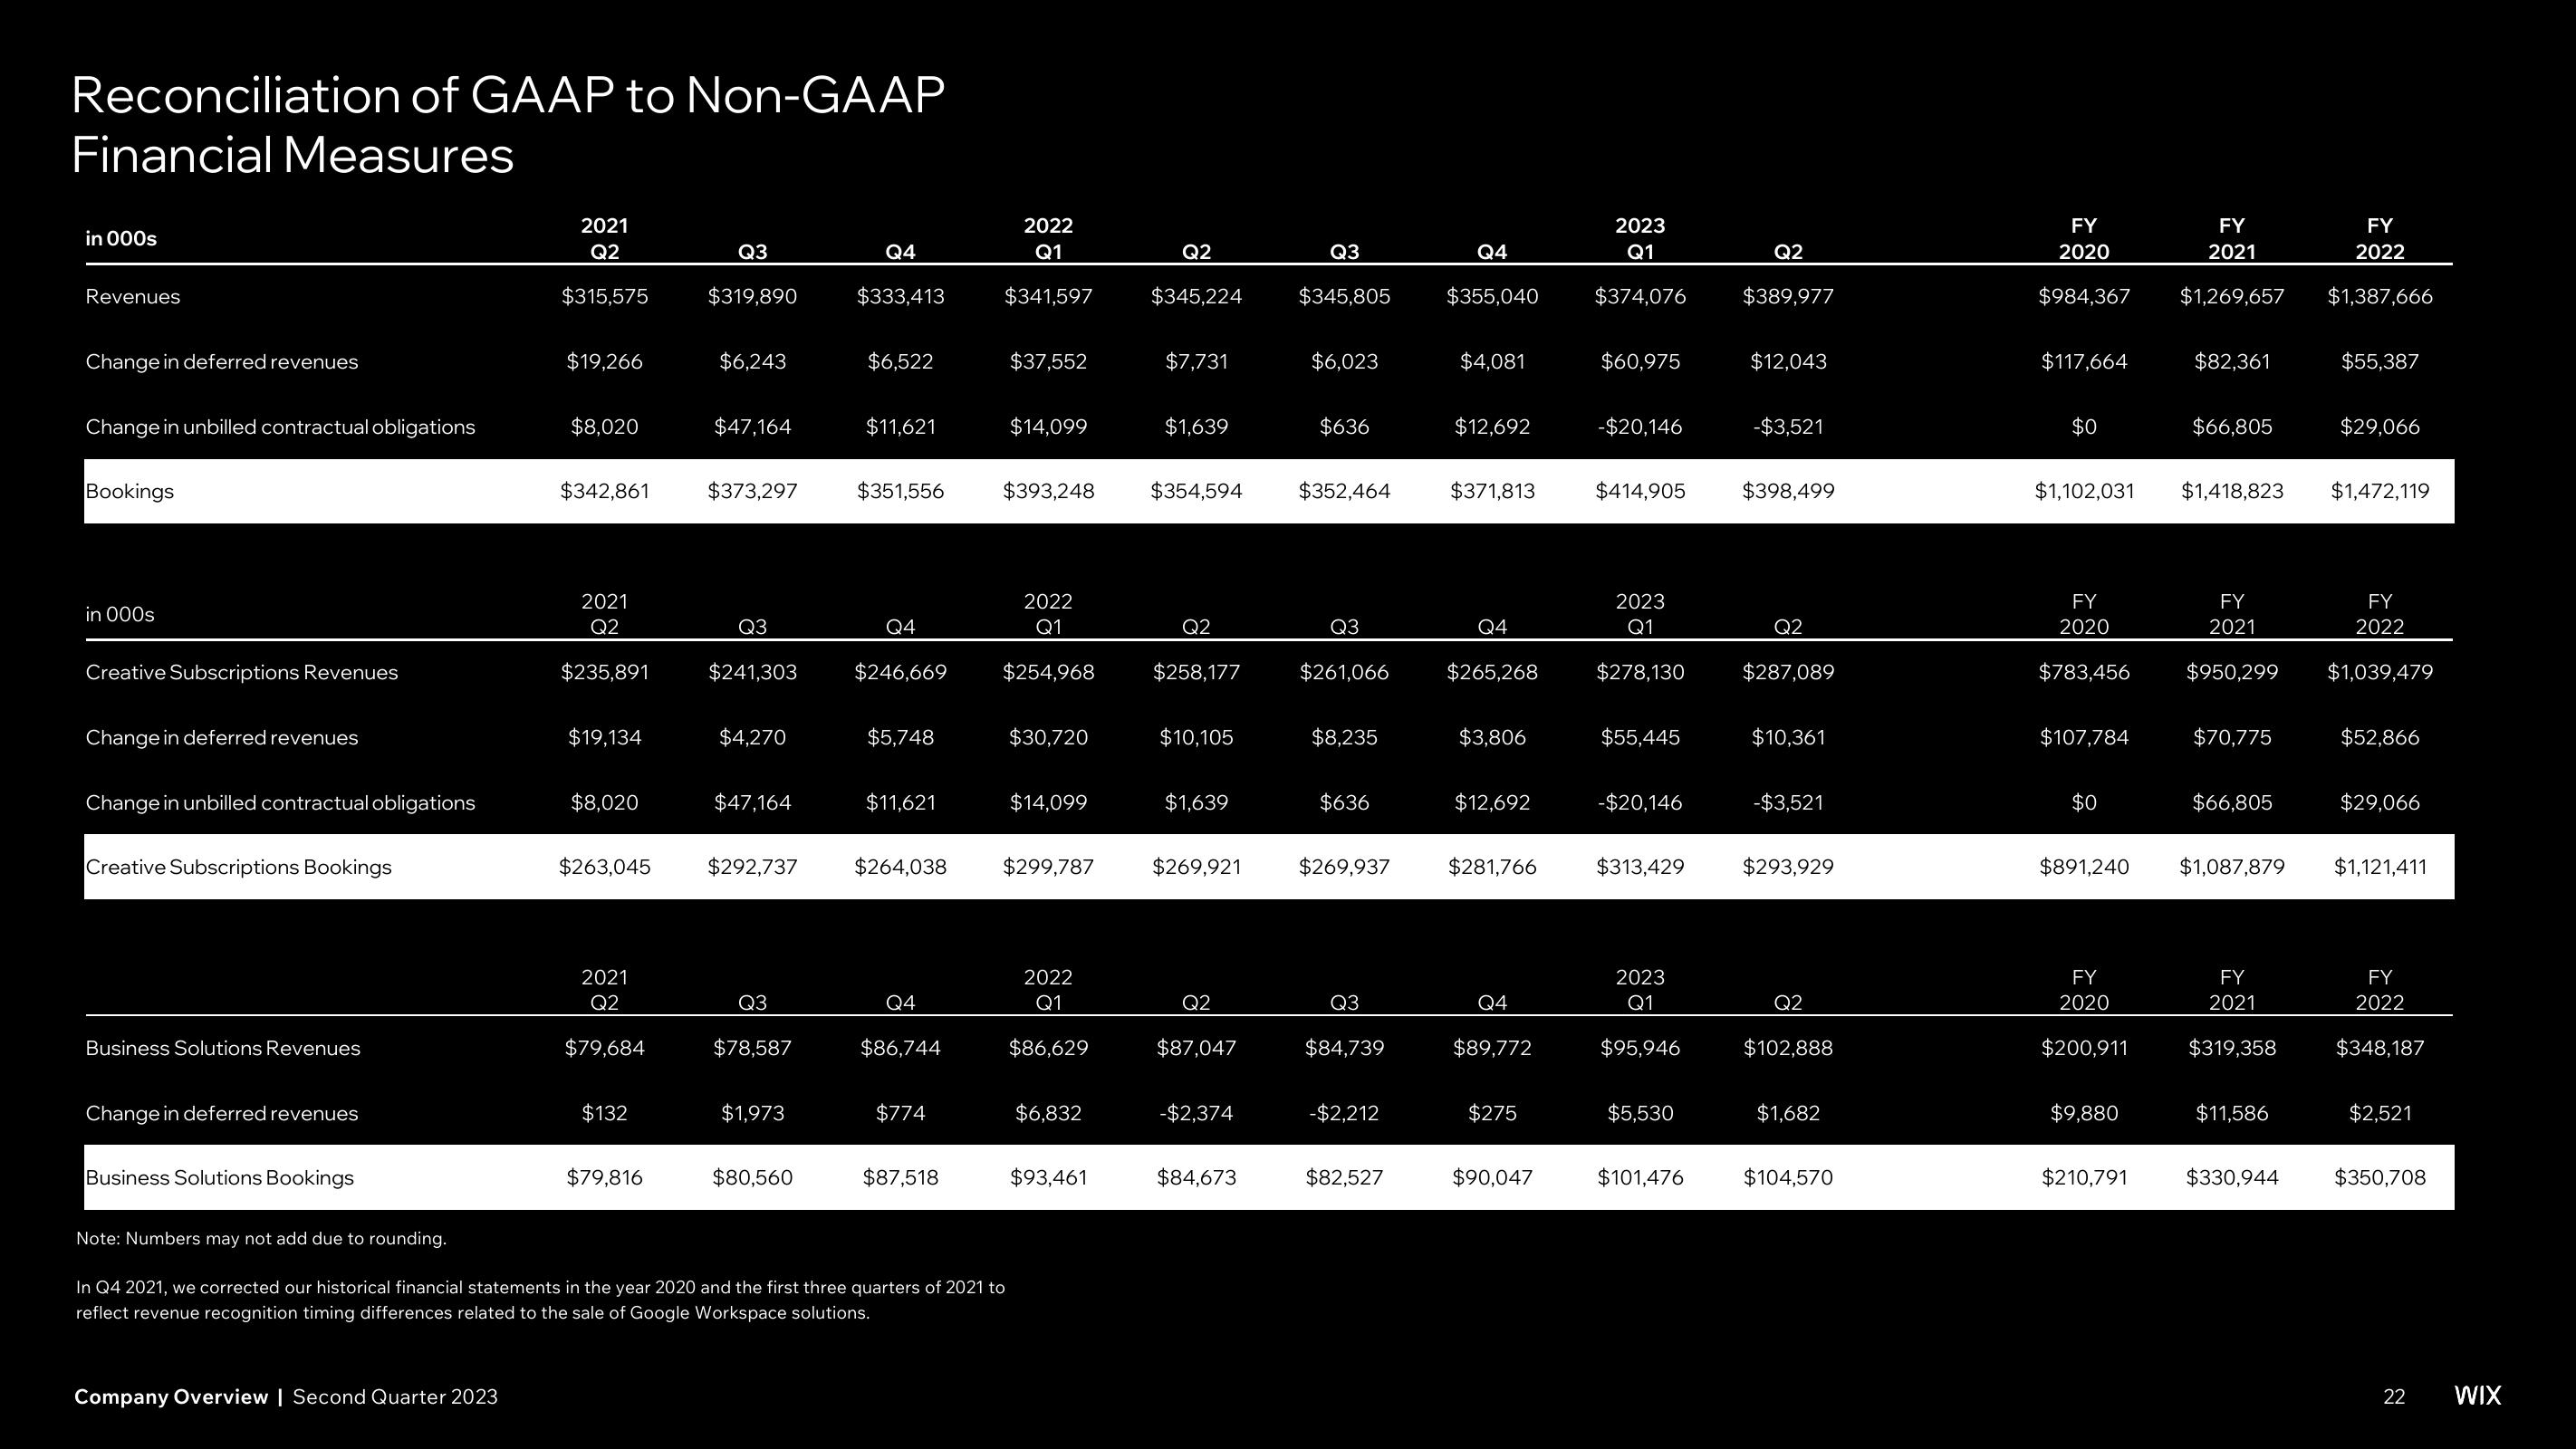
Reconciliation of GAAP to Non-GAAP
Financial Measures
in 000s
Revenues
Change in deferred revenues
Change in unbilled contractual obligations
Bookings
in 000s
Creative Subscriptions Revenues
Change in deferred revenues
Change in unbilled contractual obligations
Creative Subscriptions Bookings
Business Solutions Revenues
Change in deferred revenues
Business Solutions Bookings
2021
Q2
$315,575
Company Overview | Second Quarter 2023
$19,266
$8,020
$342,861
2021
Q2
$235,891
$19,134
$8,020
$263,045
2021
Q2
$79,684
$132
$79,816
Q3
$319,890
$6,243
$47,164
$373,297
Q3
$241,303
$4,270
$47,164
$292,737
Q3
$78,587
$1,973
$80,560
Q4
$333,413
$6,522
$11,621
$351,556
Q4
$246,669
$5,748
$11,621
$264,038
Q4
$86,744
$774
$87,518
2022
Q1
$341,597
$37,552
$14,099
$393,248
Note: Numbers may not add due to rounding.
In Q4 2021, we corrected our historical financial statements in the year 2020 and the first three quarters of 2021 to
reflect revenue recognition timing differences related to the sale of Google Workspace solutions.
2022
Q1
$254,968
$30,720
$14,099
$299,787
2022
Q1
$86,629
$6,832
$93,461
Q2
$345,224
$7,731
$1,639
$354,594
Q2
$258,177
$10,105
$1,639
$269,921
Q2
$87,047
-$2,374
$84,673
Q3
$345,805
$6,023
$636
$352,464
Q3
$261,066
$8,235
$636
$269,937
Q3
$84,739
-$2,212
$82,527
Q4
$355,040
$4,081
$12,692
$371,813
Q4
$265,268
$3,806
$12,692
$281,766
Q4
$89,772
$275
$90,047
2023
Q1
$374,076
$60,975
-$20,146
$414,905
2023
Q1
$278,130
$55,445
-$20,146
$313,429
2023
Q1
$95,946
$5,530
$101,476
Q2
$389,977
$12,043
-$3,521
$398,499
Q2
$287,089
$10,361
-$3,521
$293,929
Q2
$102,888
$1,682
$104,570
FY
2020
$984,367
$117,664
$0
$1,102,031
FY
2020
$783,456
$107,784
$0
$891,240
FY
2020
$200,911
$9,880
$210,791
FY
2021
FY
2022
$1,269,657 $1,387,666
$82,361
$66,805
$1,418,823
FY
2021
$950,299
$70,775
$66,805
$1,087,879
FY
2021
$319,358
$11,586
$330,944
$55,387
$29,066
$1,472,119
FY
2022
$1,039,479
$52,866
$29,066
$1,121,411
FY
2022
$348,187
$2,521
$350,708
22
WIXView entire presentation