Syniverse SPAC Presentation Deck
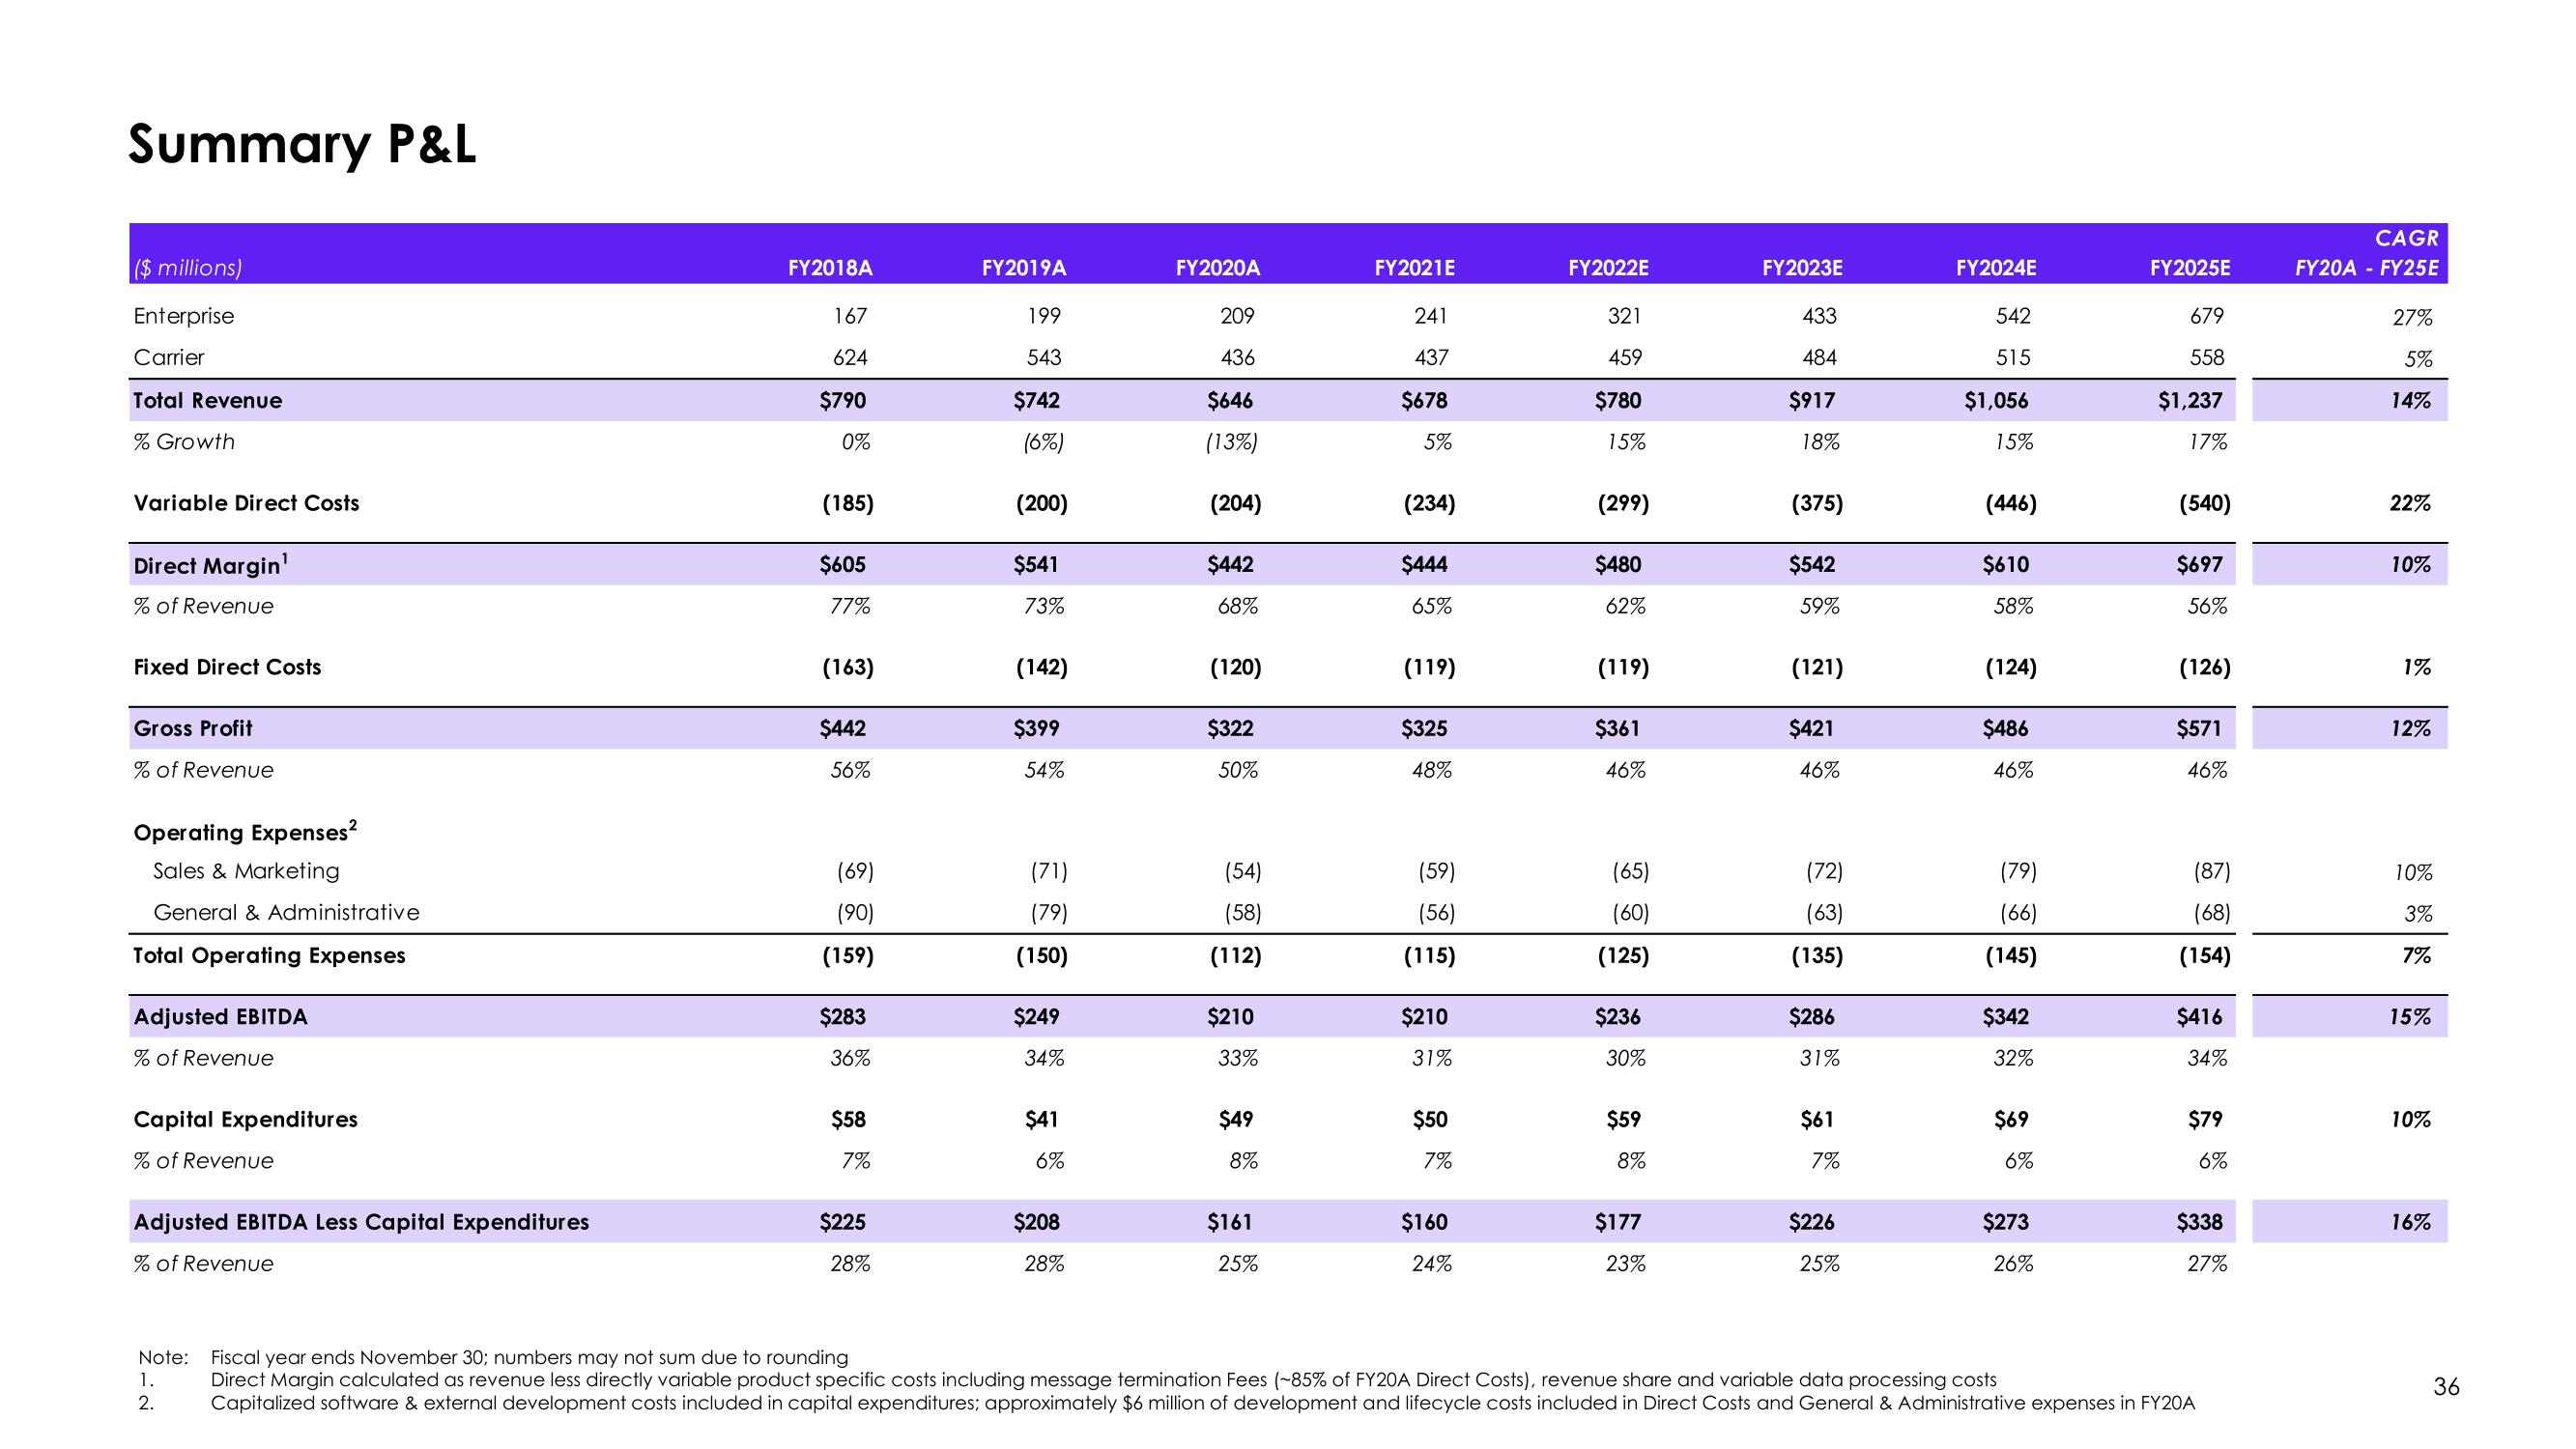
Summary P&L
($ millions)
Enterprise
Carrier
Total Revenue
% Growth
Variable Direct Costs
Direct Margin¹
% of Revenue
Fixed Direct Costs
Gross Profit
% of Revenue
Operating Expenses²
Sales & Marketing
General & Administrative
Total Operating Expenses
Adjusted EBITDA
% of Revenue
Capital Expenditures
% of Revenue
Adjusted EBITDA Less Capital Expenditures
% of Revenue
FY2018A
1.
2.
167
624
$790
0%
(185)
$605
77%
(163)
$442
56%
(69)
(90)
(159)
$283
36%
$58
7%
$225
28%
FY2019A
199
543
$742
(6%)
(200)
$541
73%
(142)
$399
54%
(71)
(79)
(150)
$249
34%
$41
6%
$208
28%
FY2020A
209
436
$646
(13%)
(204)
$442
68%
(120)
$322
50%
(54)
(58)
(112)
$210
33%
$49
8%
$161
25%
FY2021E
241
437
$678
5%
(234)
$444
65%
(119)
$325
48%
(59)
(56)
(115)
$210
31%
$50
7%
$160
24%
FY2022E
321
459
$780
15%
(299)
$480
62%
(119)
$361
46%
(65)
(60)
(125)
$236
30%
$59
8%
$177
23%
FY2023E
433
484
$917
18%
(375)
$542
59%
(121)
$421
46%
(72)
(63)
(135)
$286
31%
$61
7%
$226
25%
FY2024E
542
515
$1,056
15%
(446)
$610
58%
(124)
$486
46%
(79)
(66)
(145)
$342
32%
$69
6%
$273
26%
FY2025E
679
558
$1,237
17%
(540)
$697
56%
(126)
$571
46%
(87)
(68)
(154)
$416
34%
$79
6%
$338
27%
Note: Fiscal year ends November 30; numbers may not sum due to rounding
Direct Margin calculated as revenue less directly variable product specific costs including message termination Fees (~85% of FY20A Direct Costs), revenue share and variable data processing costs
Capitalized software & external development costs included in capital expenditures; approximately $6 million of development and lifecycle costs included in Direct Costs and General & Administrative expenses in FY20A
CAGR
FY20A - FY25E
27%
5%
14%
22%
10%
1%
12%
10%
3%
7%
15%
10%
16%
36View entire presentation