Owens&Minor Investor Day Presentation Deck
91
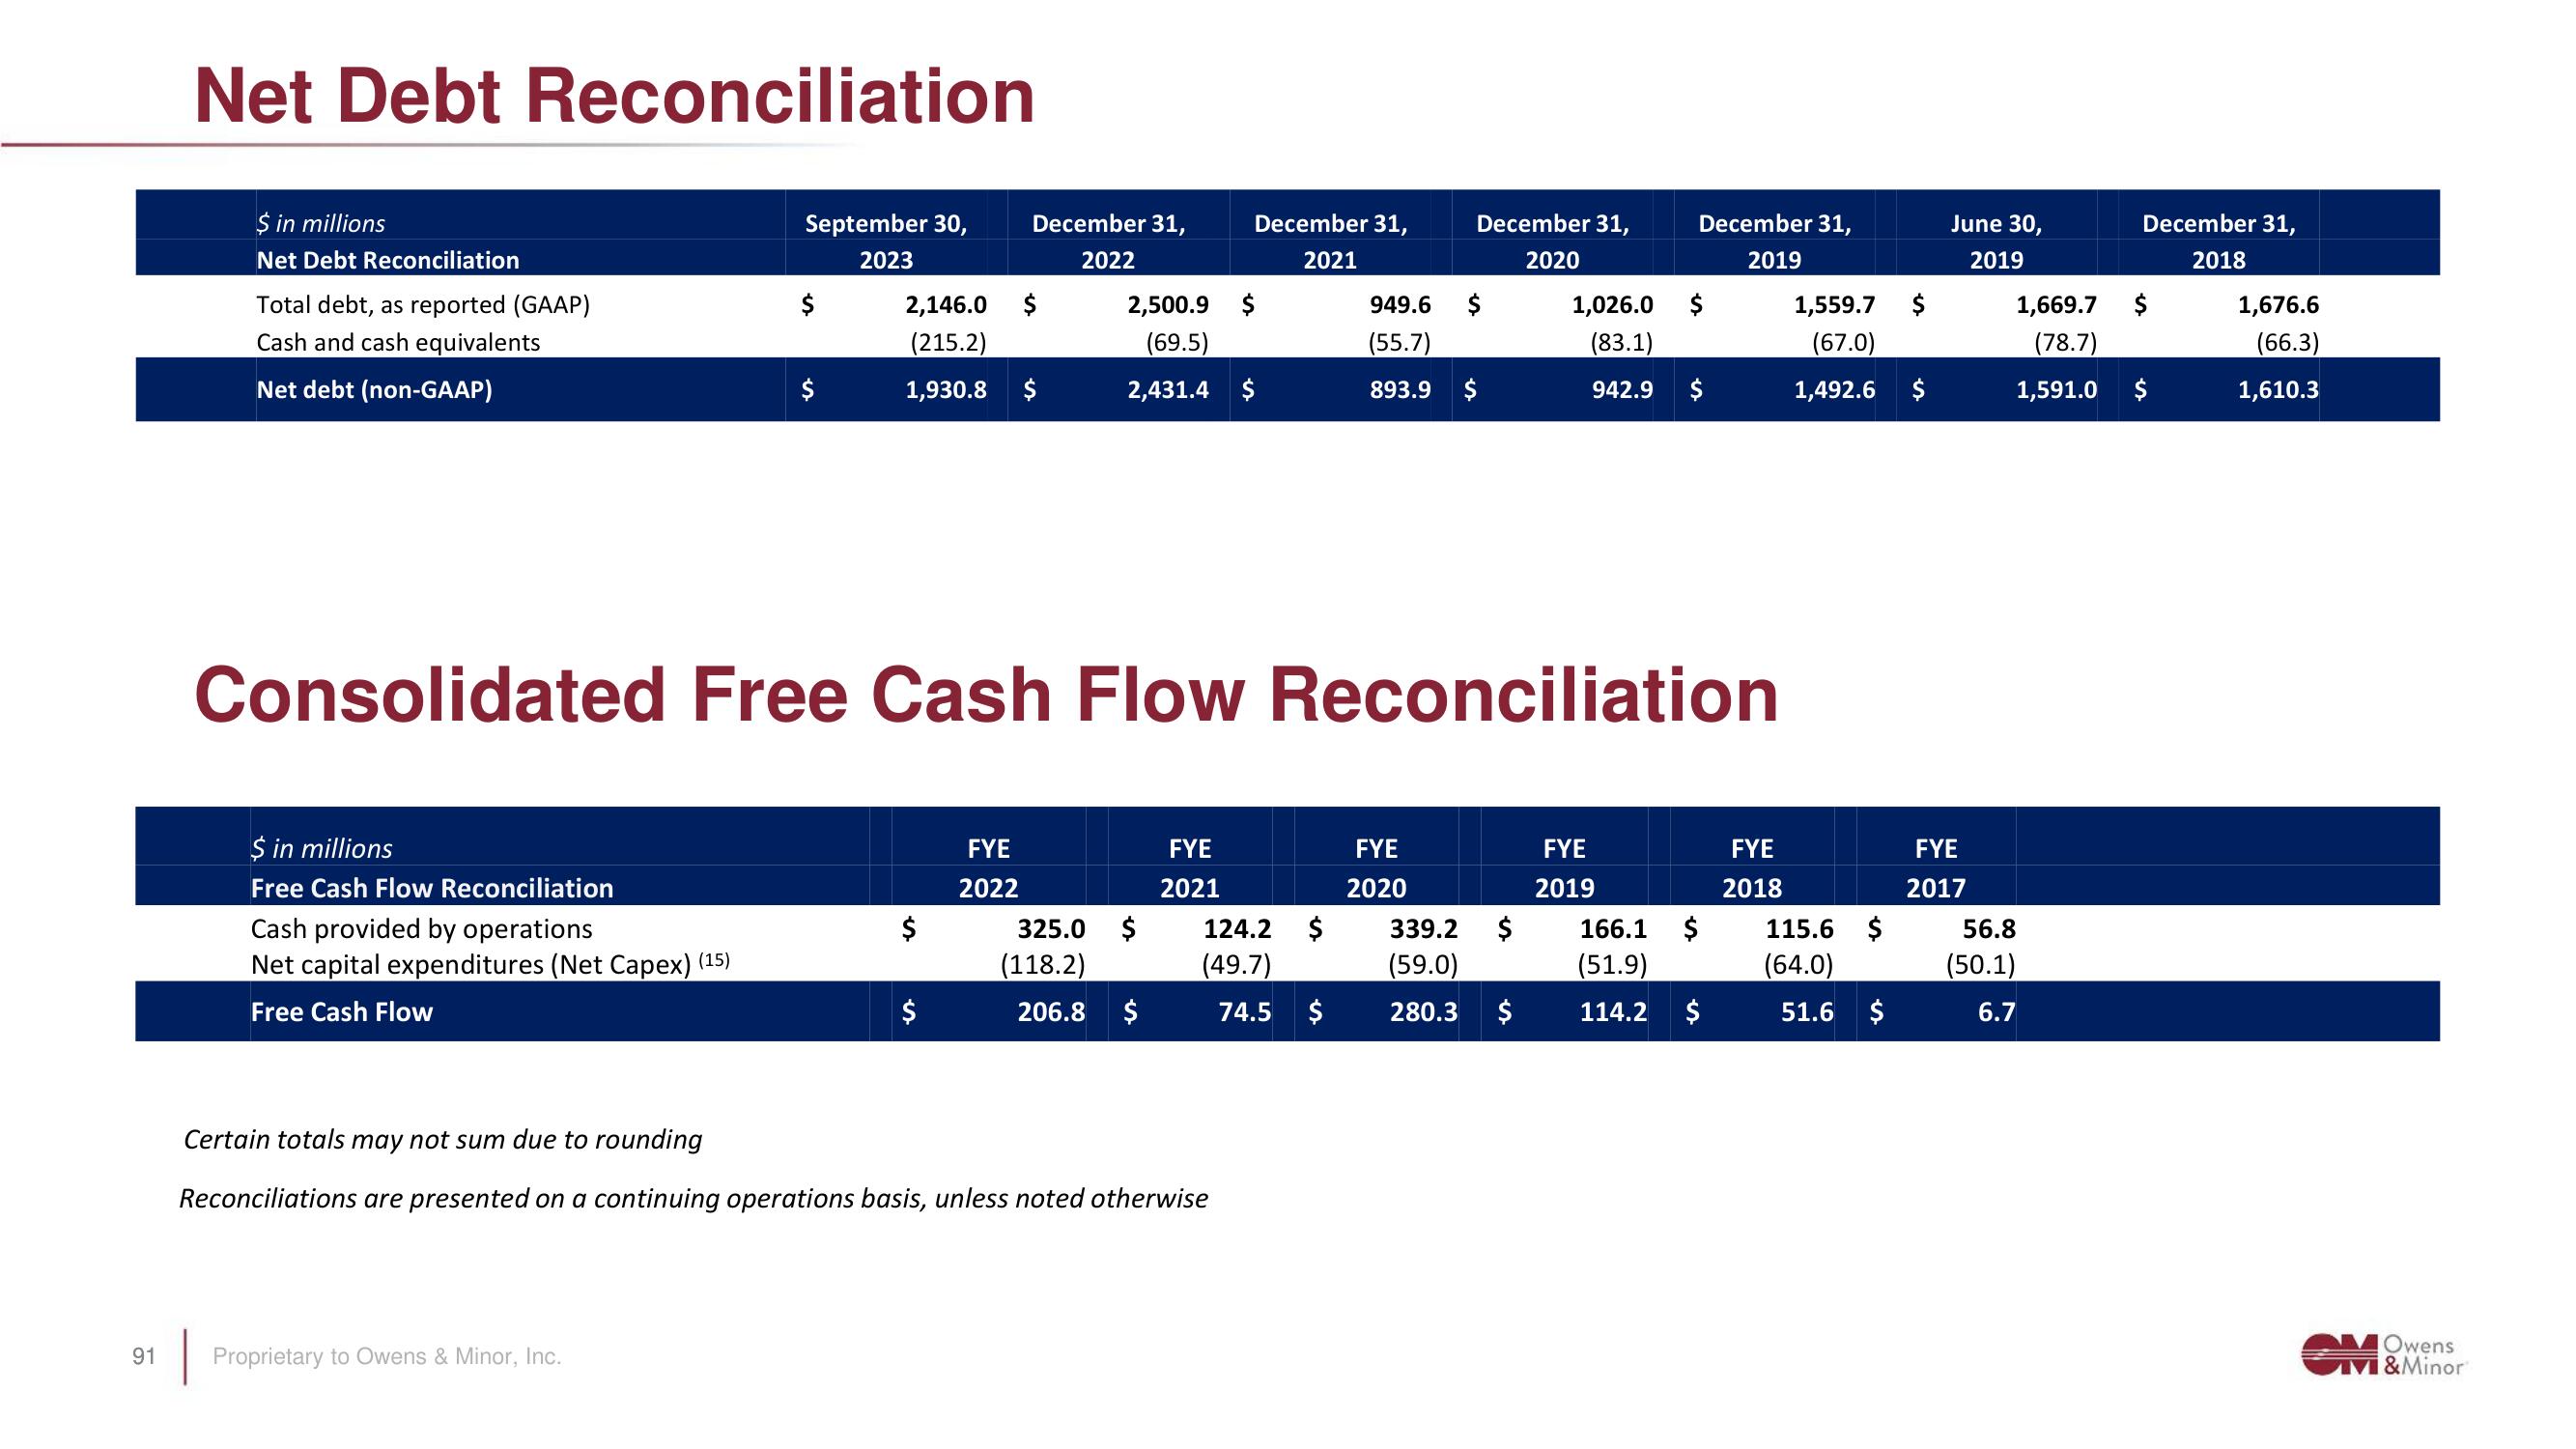
Net Debt Reconciliation
$ in millions
Net Debt Reconciliation
Total debt, as reported (GAAP)
Cash and cash equivalents
Net debt (non-GAAP)
$ in millions
Free Cash Flow Reconciliation
Cash provided by operations
Net capital expenditures (Net Capex) (15)
Free Cash Flow
September 30,
2023
2,146.0
(215.2)
1,930.8
Proprietary to Owens & Minor, Inc.
$
$
December 31,
2022
FYE
2022
$
2,500.9 $
(69.5)
2,431.4 $
325.0 $
(118.2)
206.8 $
December 31,
2021
FYE
2021
Certain totals may not sum due to rounding
Reconciliations are presented on a continuing operations basis, unless noted otherwise
Consolidated Free Cash Flow Reconciliation
124.2 $
(49.7)
74.5 $
949.6
(55.7)
893.9
December 31,
2020
FYE
2020
$
$
339.2 $
(59.0)
280.3
1,026.0
(83.1)
$
December 31,
2019
942.9 $
FYE
2019
$
166.1
(51.9)
114.2
$
FYE
2018
1,559.7 $
(67.0)
1,492.6
115.6 $
(64.0)
51.6 $
June 30,
2019
FYE
2017
December 31,
2018
56.8
(50.1)
6.7
1,669.7
(78.7)
1,591.0 $
$
1,676.6
(66.3)
1,610.3
MOwens
M&MinorView entire presentation