Nikola Results Presentation Deck
NIKOLA.
PAGE
.
14
FINANCIAL RESULTS AT A GLANCE (1)
In Thousands
Revenue
Cost of Revenues
EBITDA
R&D
SG&A
Operating Loss
Adjusted EBITDA
Cash and Cash Equivalents (including
restricted cash)
Tumim Stone Capital ELOC
Total Available Liquidity
Q1 2021 Q2 2021 Q3 2021 Q4 2021
55,163
67,726
78,896
65,427
70,672
192,929
(120,590) (138,398) (271,825)
(118,409)
(141,232)
(265,199)
(53,434)
(73,906)
(85,020)
763,750
763,750
632,694
632,694
586,986
527,132
1,114,118
1. For reconciliation of GAAP to Non-GAAP financial measures please refer to slides 19 and 20 "Reconciliation to Non-GAAP Measures"
522,241
Q1 2022
436,210
958,451
1,887
91,166
71,547
(162,713) (151,309)
(156,882)
(149,619)
(90,385)
(79,152)
1,456
74,557
77,183
385,118
408,831
793,949
Q2 2022
18,134
47,391
63,106
79,868
(172,231)
(163,622)
(94,345)
529,224
312,537
841,761
Highlights
Revenues
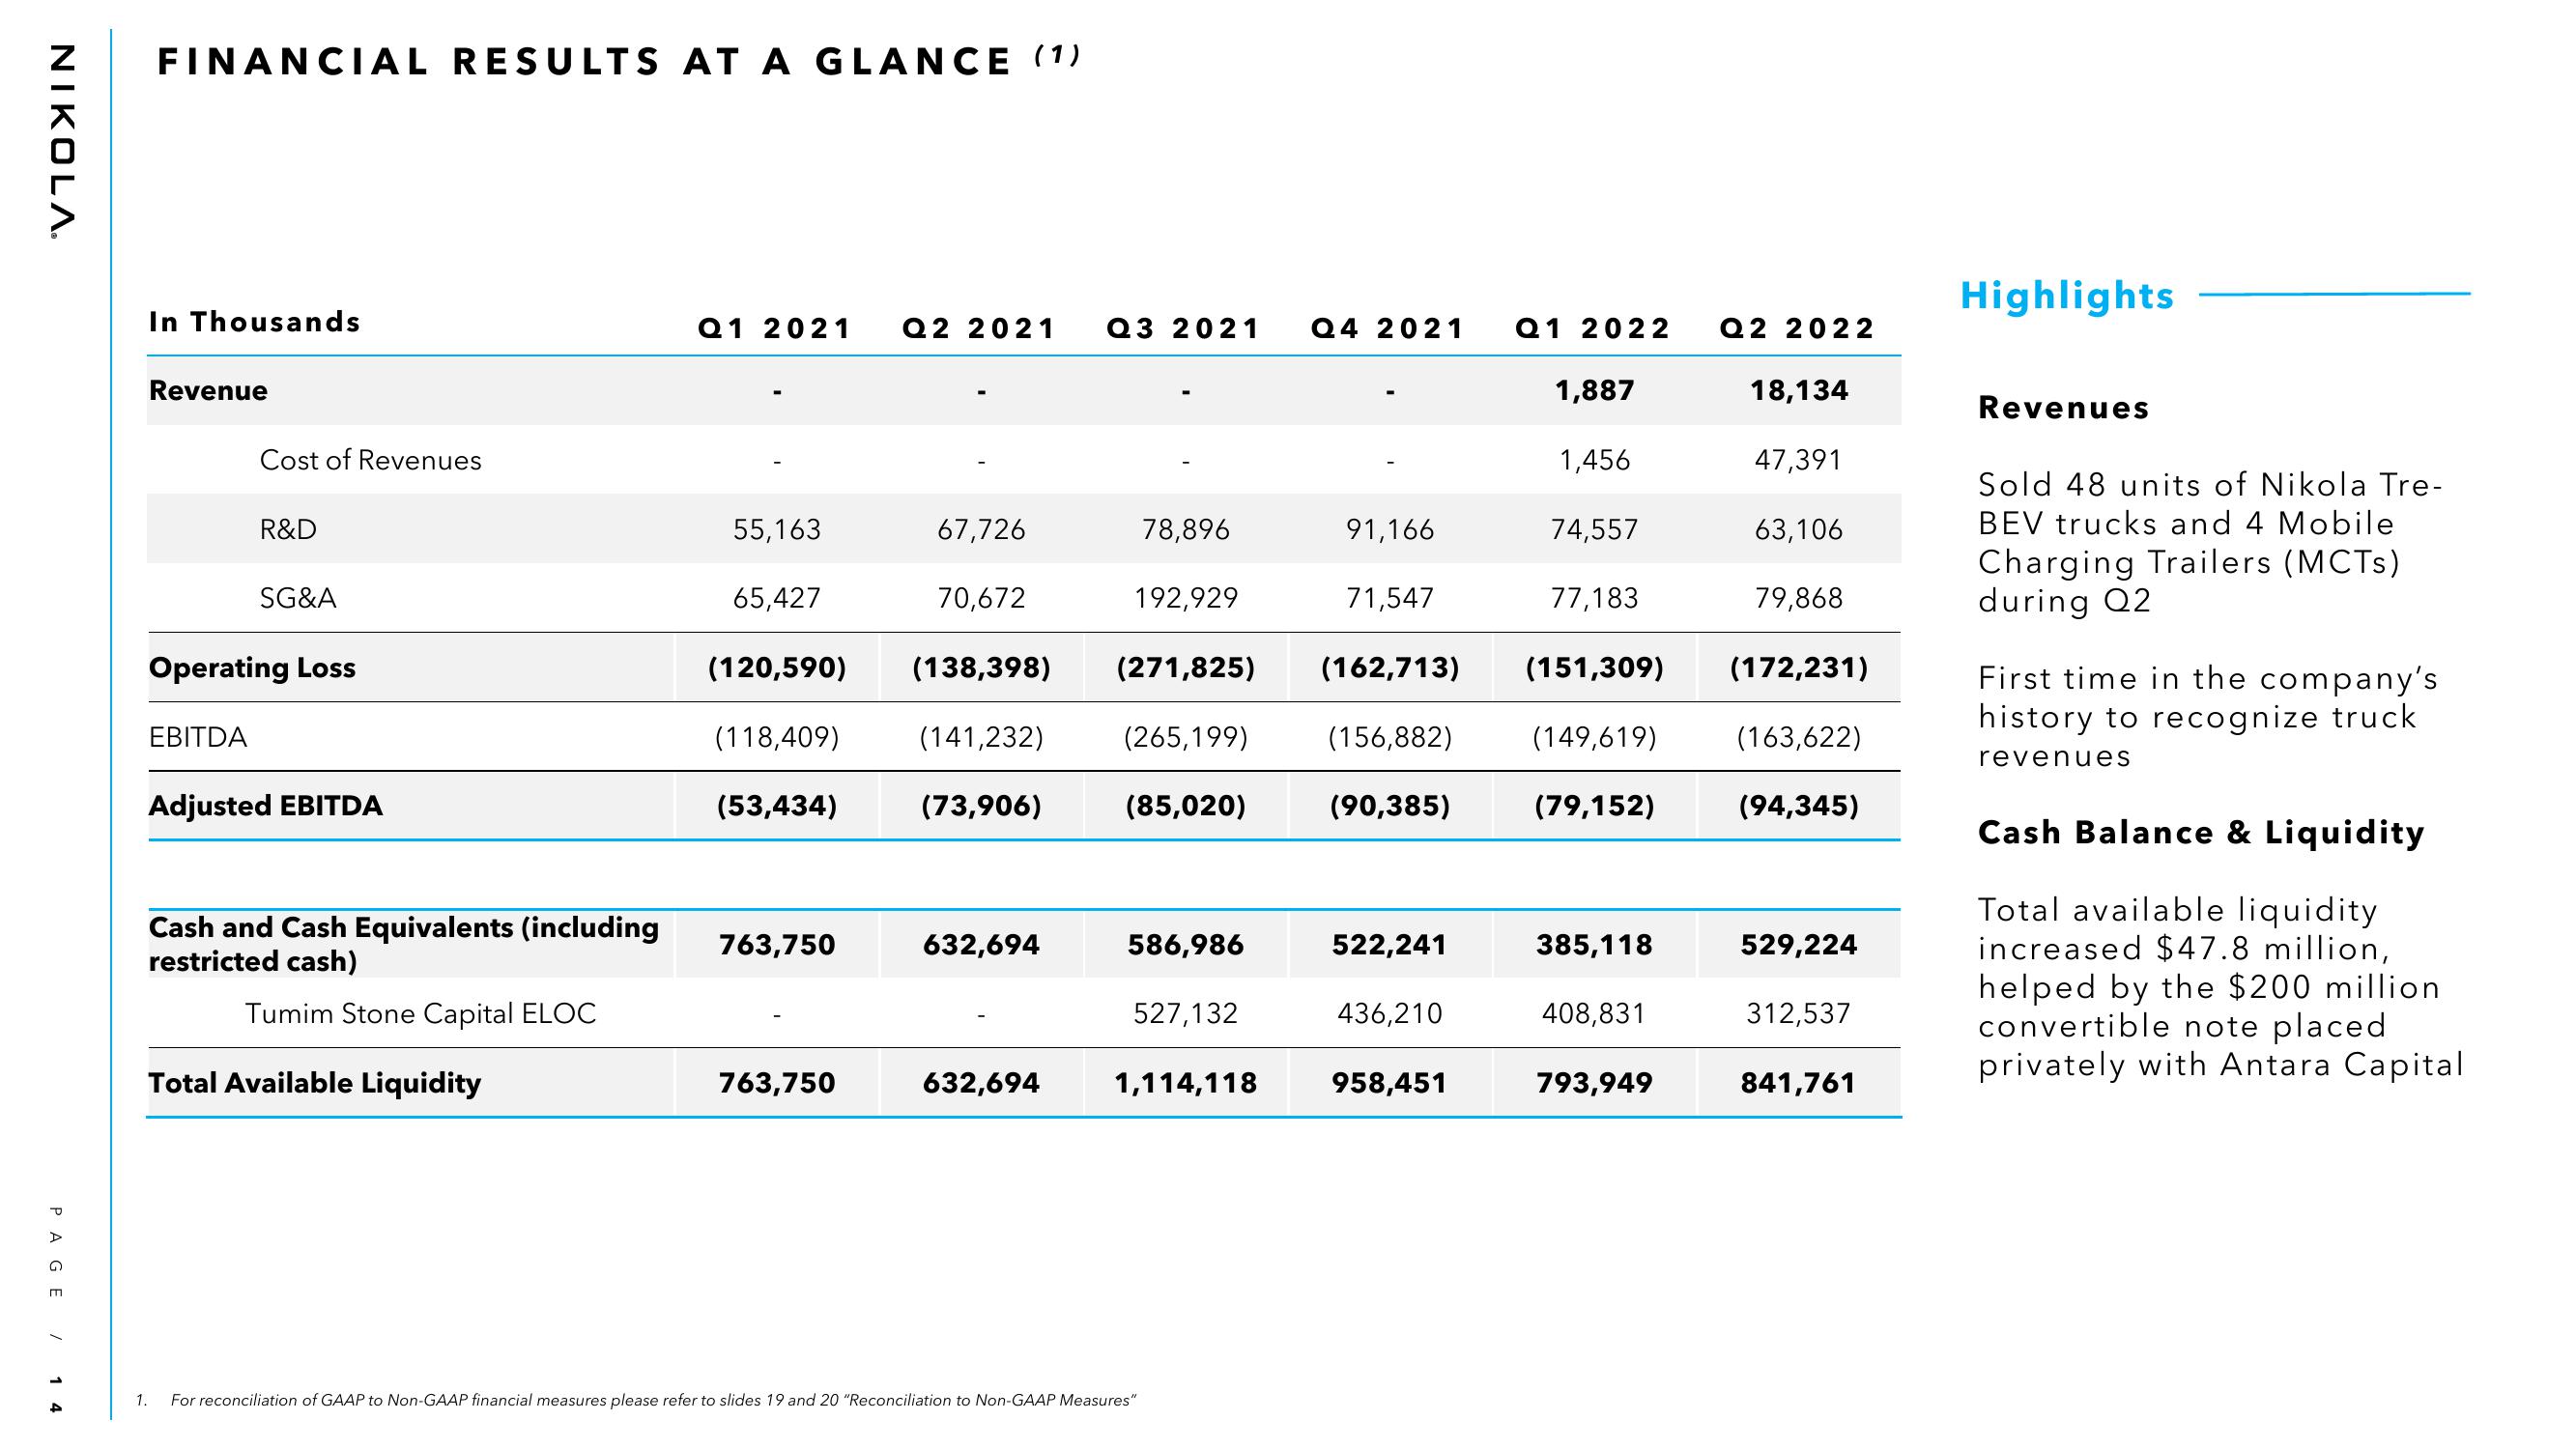
Sold 48 units of Nikola Tre-
BEV trucks and 4 Mobile
Charging Trailers (MCTS)
during Q2
First time in the company's
history to recognize truck
revenues
Cash Balance & Liquidity
Total available liquidity
increased $47.8 million,
helped by the $200 million
convertible note placed
privately with Antara CapitalView entire presentation