J.P.Morgan Results Presentation Deck slide image

J.P.Morgan Results Presentation Deck

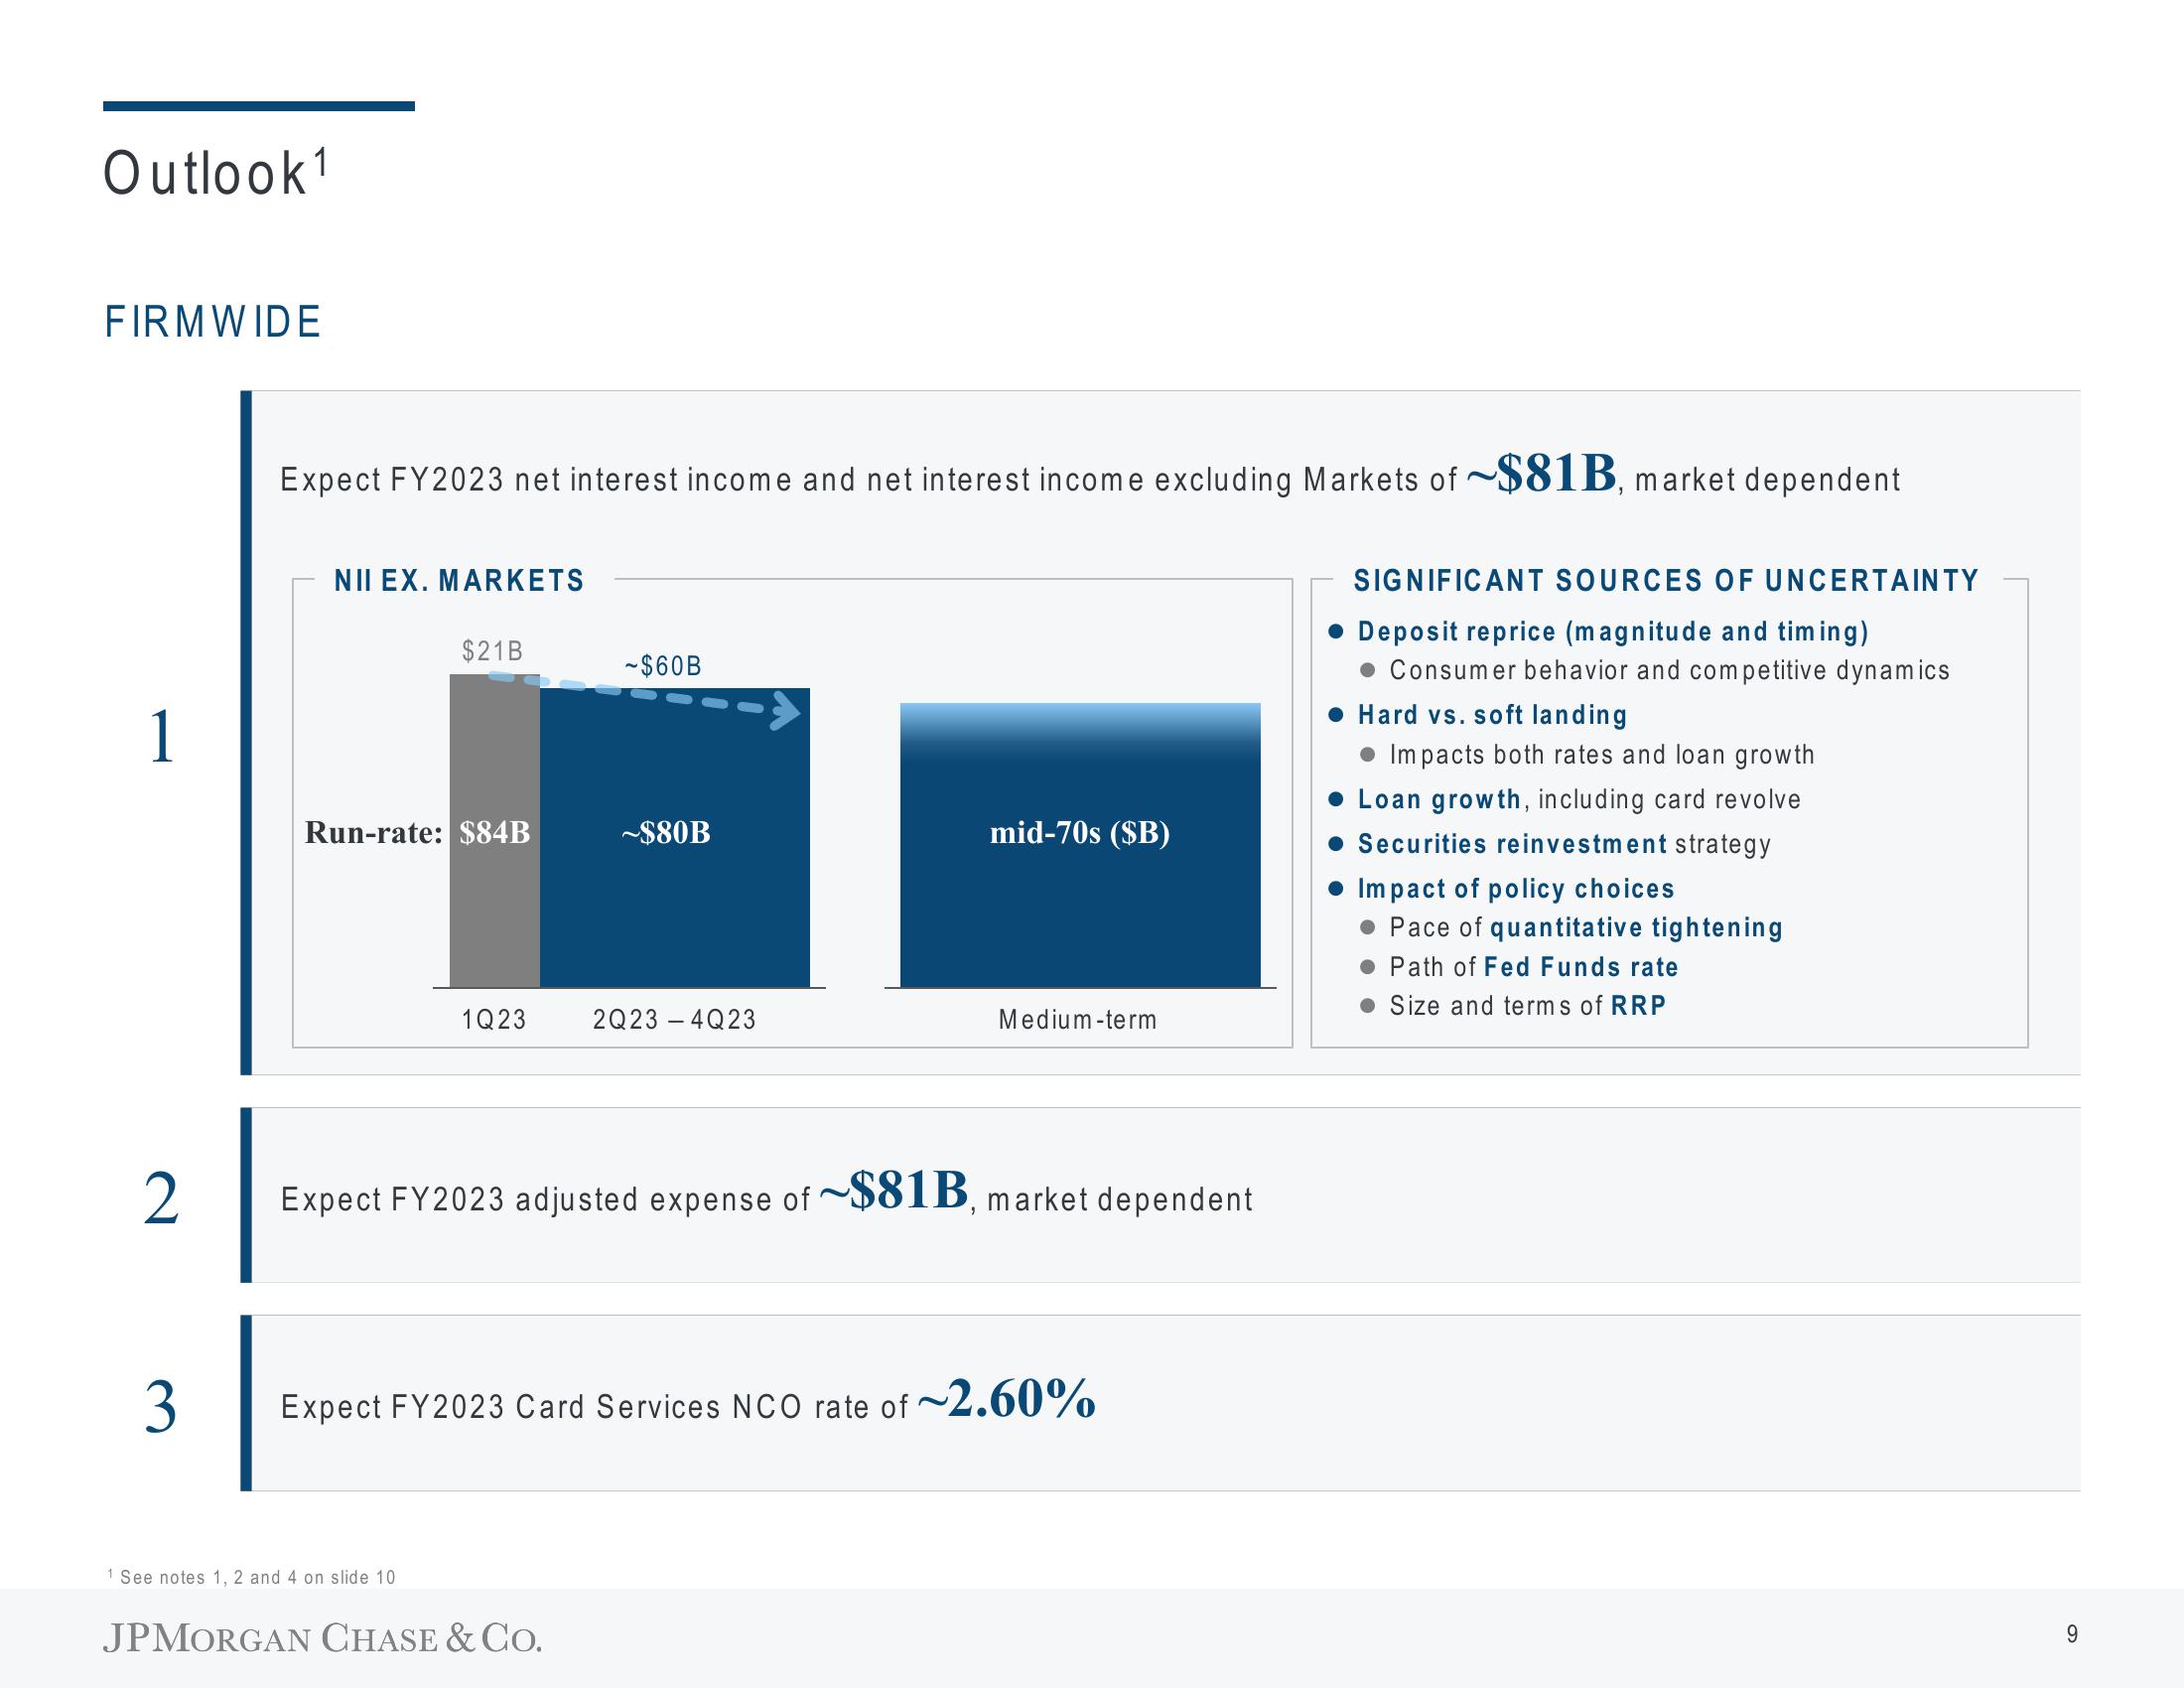
Outlook 1 FIRMWIDE 1 2 3 Expect FY2023 net interest income and net interest income excluding Markets of $81B, market dependent NII EX. MARKETS $21B Run-rate: $84B 1Q23 1 See notes 1, 2 and 4 on slide 10 -$60B ~$80B JPMORGAN CHASE & CO. 2Q23-4Q23 mid-70s ($B) Expect FY2023 adjusted expense of ~$81B, market dependent Medium-term Expect FY2023 Card Services NCO rate of ~2.60% SIGNIFICANT SOURCES OF UNCERTAINTY • Deposit reprice (magnitude and timing) Consumer behavior and competitive dynamics ● Hard vs. soft landing • Impacts both rates and loan growth Loan growth, including card revolve • Securities reinvestment strategy Impact of policy choices Pace of quantitative tightening ● Path of Fed Funds rate Size and terms of RRP 9
View entire presentation