Inovalon Results Presentation Deck
Updated 2017 Financial Guidance Summary
inovalon
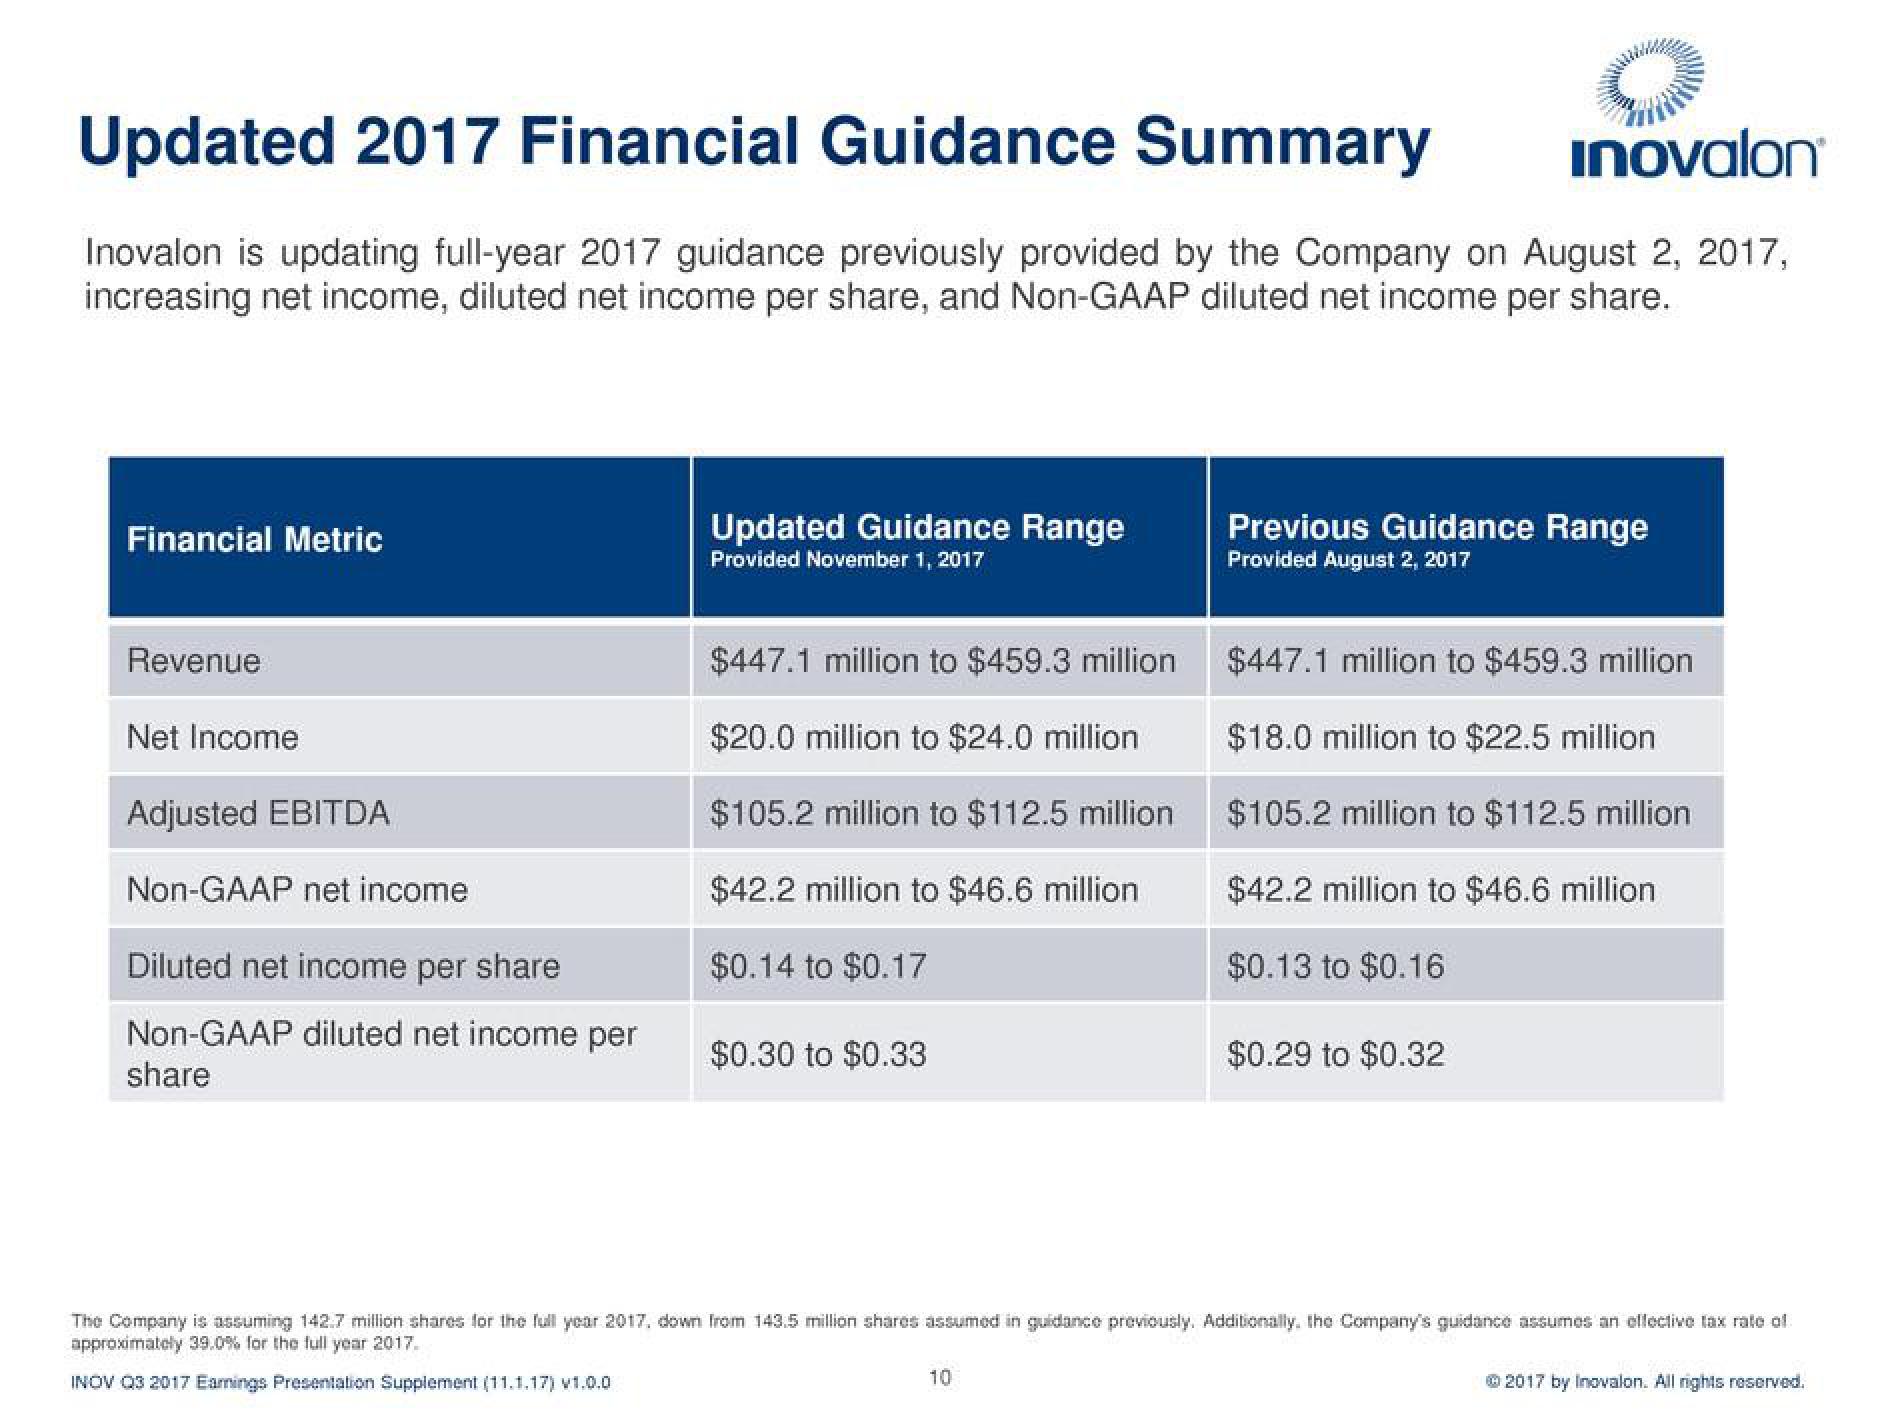
Inovalon is updating full-year 2017 guidance previously provided by the Company on August 2, 2017,
increasing net income, diluted net income per share, and Non-GAAP diluted net income per share.
Financial Metric
Revenue
Net Income
Adjusted EBITDA
Non-GAAP net income
Diluted net income per share
Non-GAAP diluted net income per
share
Updated Guidance Range
Provided November 1, 2017
$447.1 million to $459.3 million
$20.0 million to $24.0 million
$105.2 million to $112.5 million
$42.2 million to $46.6 million
$0.14 to $0.17
$0.30 to $0.33
Previous Guidance Range
Provided August 2, 2017
10
$447.1 million to $459.3 million
$18.0 million to $22.5 million
$105.2 million to $112.5 million
$42.2 million to $46.6 million
$0.13 to $0.16
$0.29 to $0.32
The Company is assuming 142.7 million shares for the full year 2017, down from 143.5 million shares assumed in guidance previously. Additionally, the Company's guidance assumes an effective tax rate of
approximately 39.0 % for the full year 2017.
INOV Q3 2017 Earnings Presentation Supplement (11.1.17) v1.0.0
Ⓒ2017 by Inovalon. All rights reserved.View entire presentation