TPG Results Presentation Deck
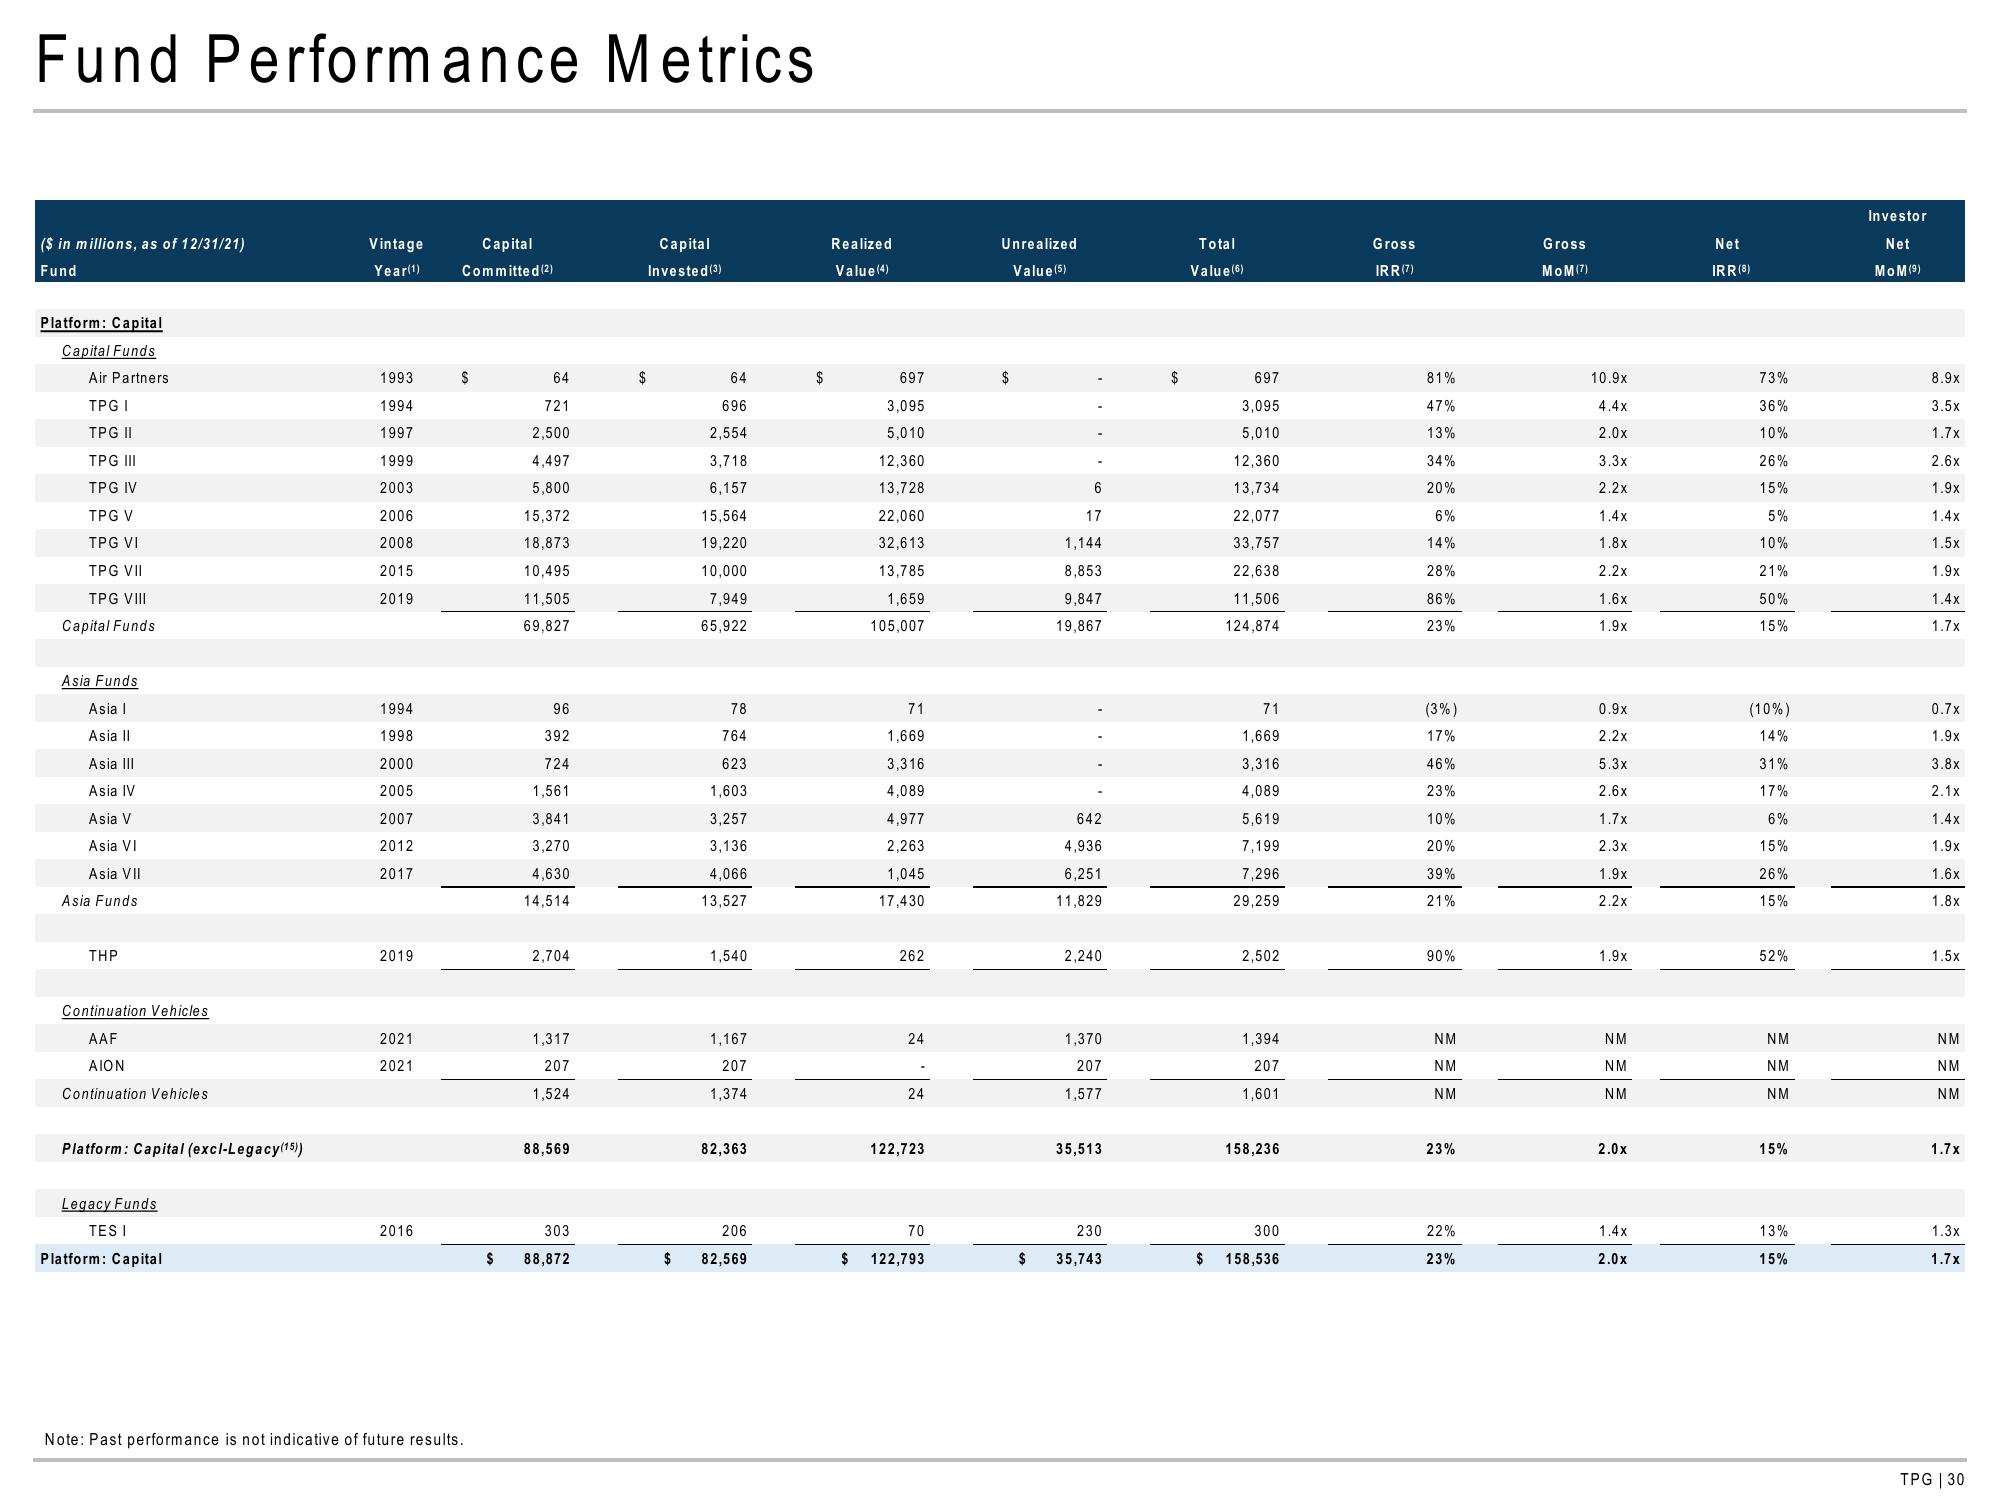
Fund Performance Metrics
($ in millions, as of 12/31/21)
Fund
Platform: Capital
Capital Funds
Air Partners
TPG I
TPG II
TPG III
TPG IV
TPG V
TPG VI
TPG VII
TPG VIII
Capital Funds
Asia Funds
Asia I
Asia II
Asia III
Asia IV
Asia V
Asia VI
Asia VII
Asia Funds
THP
Continuation Vehicles
AAF
AION
Continuation Vehicles
Platform: Capital (excl-Legacy(15))
Legacy Funds
TES I
Platform: Capital
Vintage
Year(1)
1993
1994
1997
1999
2003
2006
2008
2015
2019
1994
1998
2000
2005
2007
2012
2017
2019
2021
2021
2016
Capital
Committed (2)
S
Note: Past performance is not indicative of future results.
$
64
721
2,500
4,497
5,800
15,372
18,873
10,495
11,505
69,827
96
392
724
1,561
3,841
3.270
4,630
14,514
2,704
1,317
207
1,524
88,569
303
88,872
Capital
Invested (3)
$
64
696
2,554
3,718
6,157
15,564
19,220
10,000
7,949
65,922
78
764
623
1,603
3,257
3.136.
4,066
13,527
1,540
1,167
207
1,374
82,363
206
$ 82,569
$
Realized
Value (4)
$
697
3,095
5,010
12,360
13,728
22,060
32,613
13,785
1,659
105,007
71
1,669
3,316
4,089
4,977
2,263
1,045
17,430
262
24
24
122,723
70
122,793
Unrealized
Value (5)
$
6
17
1,144
8,853
9,847
19,867
642
4,936
6.251
11,829
2,240
1,370
207
1,577
35,513
230
$ 35,743
$
Total
Value (6)
697
3,095
5,010
12,360
13,734
22,077
33,757
22,638
11,506
124,874
71
1,669
3,316
4,089
5,619
7,199
7,296
29,259
2,502
1,394
207
1,601
158,236
300
$ 158,536
Gross
IRR (7)
81%
47%
13%
34%
20%
6%
14%
28%
86%
23%
(3%)
17%
46%
23%
10%
20%
39%
21%
90%
NM
NM
NM
23%
22%
23%
Gross
MOM (7)
10.9x
4.4x
2.0x
3.3x
2.2x
1.4x
1.8x
2.2x
1.6x
1.9x
0.9x
2.2x
5.3x
2.6x
1.7x
2,3x
1.9x
2.2x
1.9x
NM
NM
NM
2.0x
1.4x
2.0x
Net
IRR (8)
73%
36%
10%
26%
15%
5%
10%
21%
50%
15%
(10%)
14%
31%
17%
6%
15%
26%
15%
52%
NM
NM
NM
15%
13%
15%
Investor
Net
MOM (⁹)
8.9x
3.5x
1.7x
2.6x
1.9x
1.4x
1.5x
1.9x
1.4x
1.7x
0.7x
1.9x
3.8x
2.1x
1.4x
1.9x
1.6x
1.8x
1.5x
NM
NM
NM
1.7x
1.3x
1.7x
TPG | 30View entire presentation