Ford Results Presentation Deck
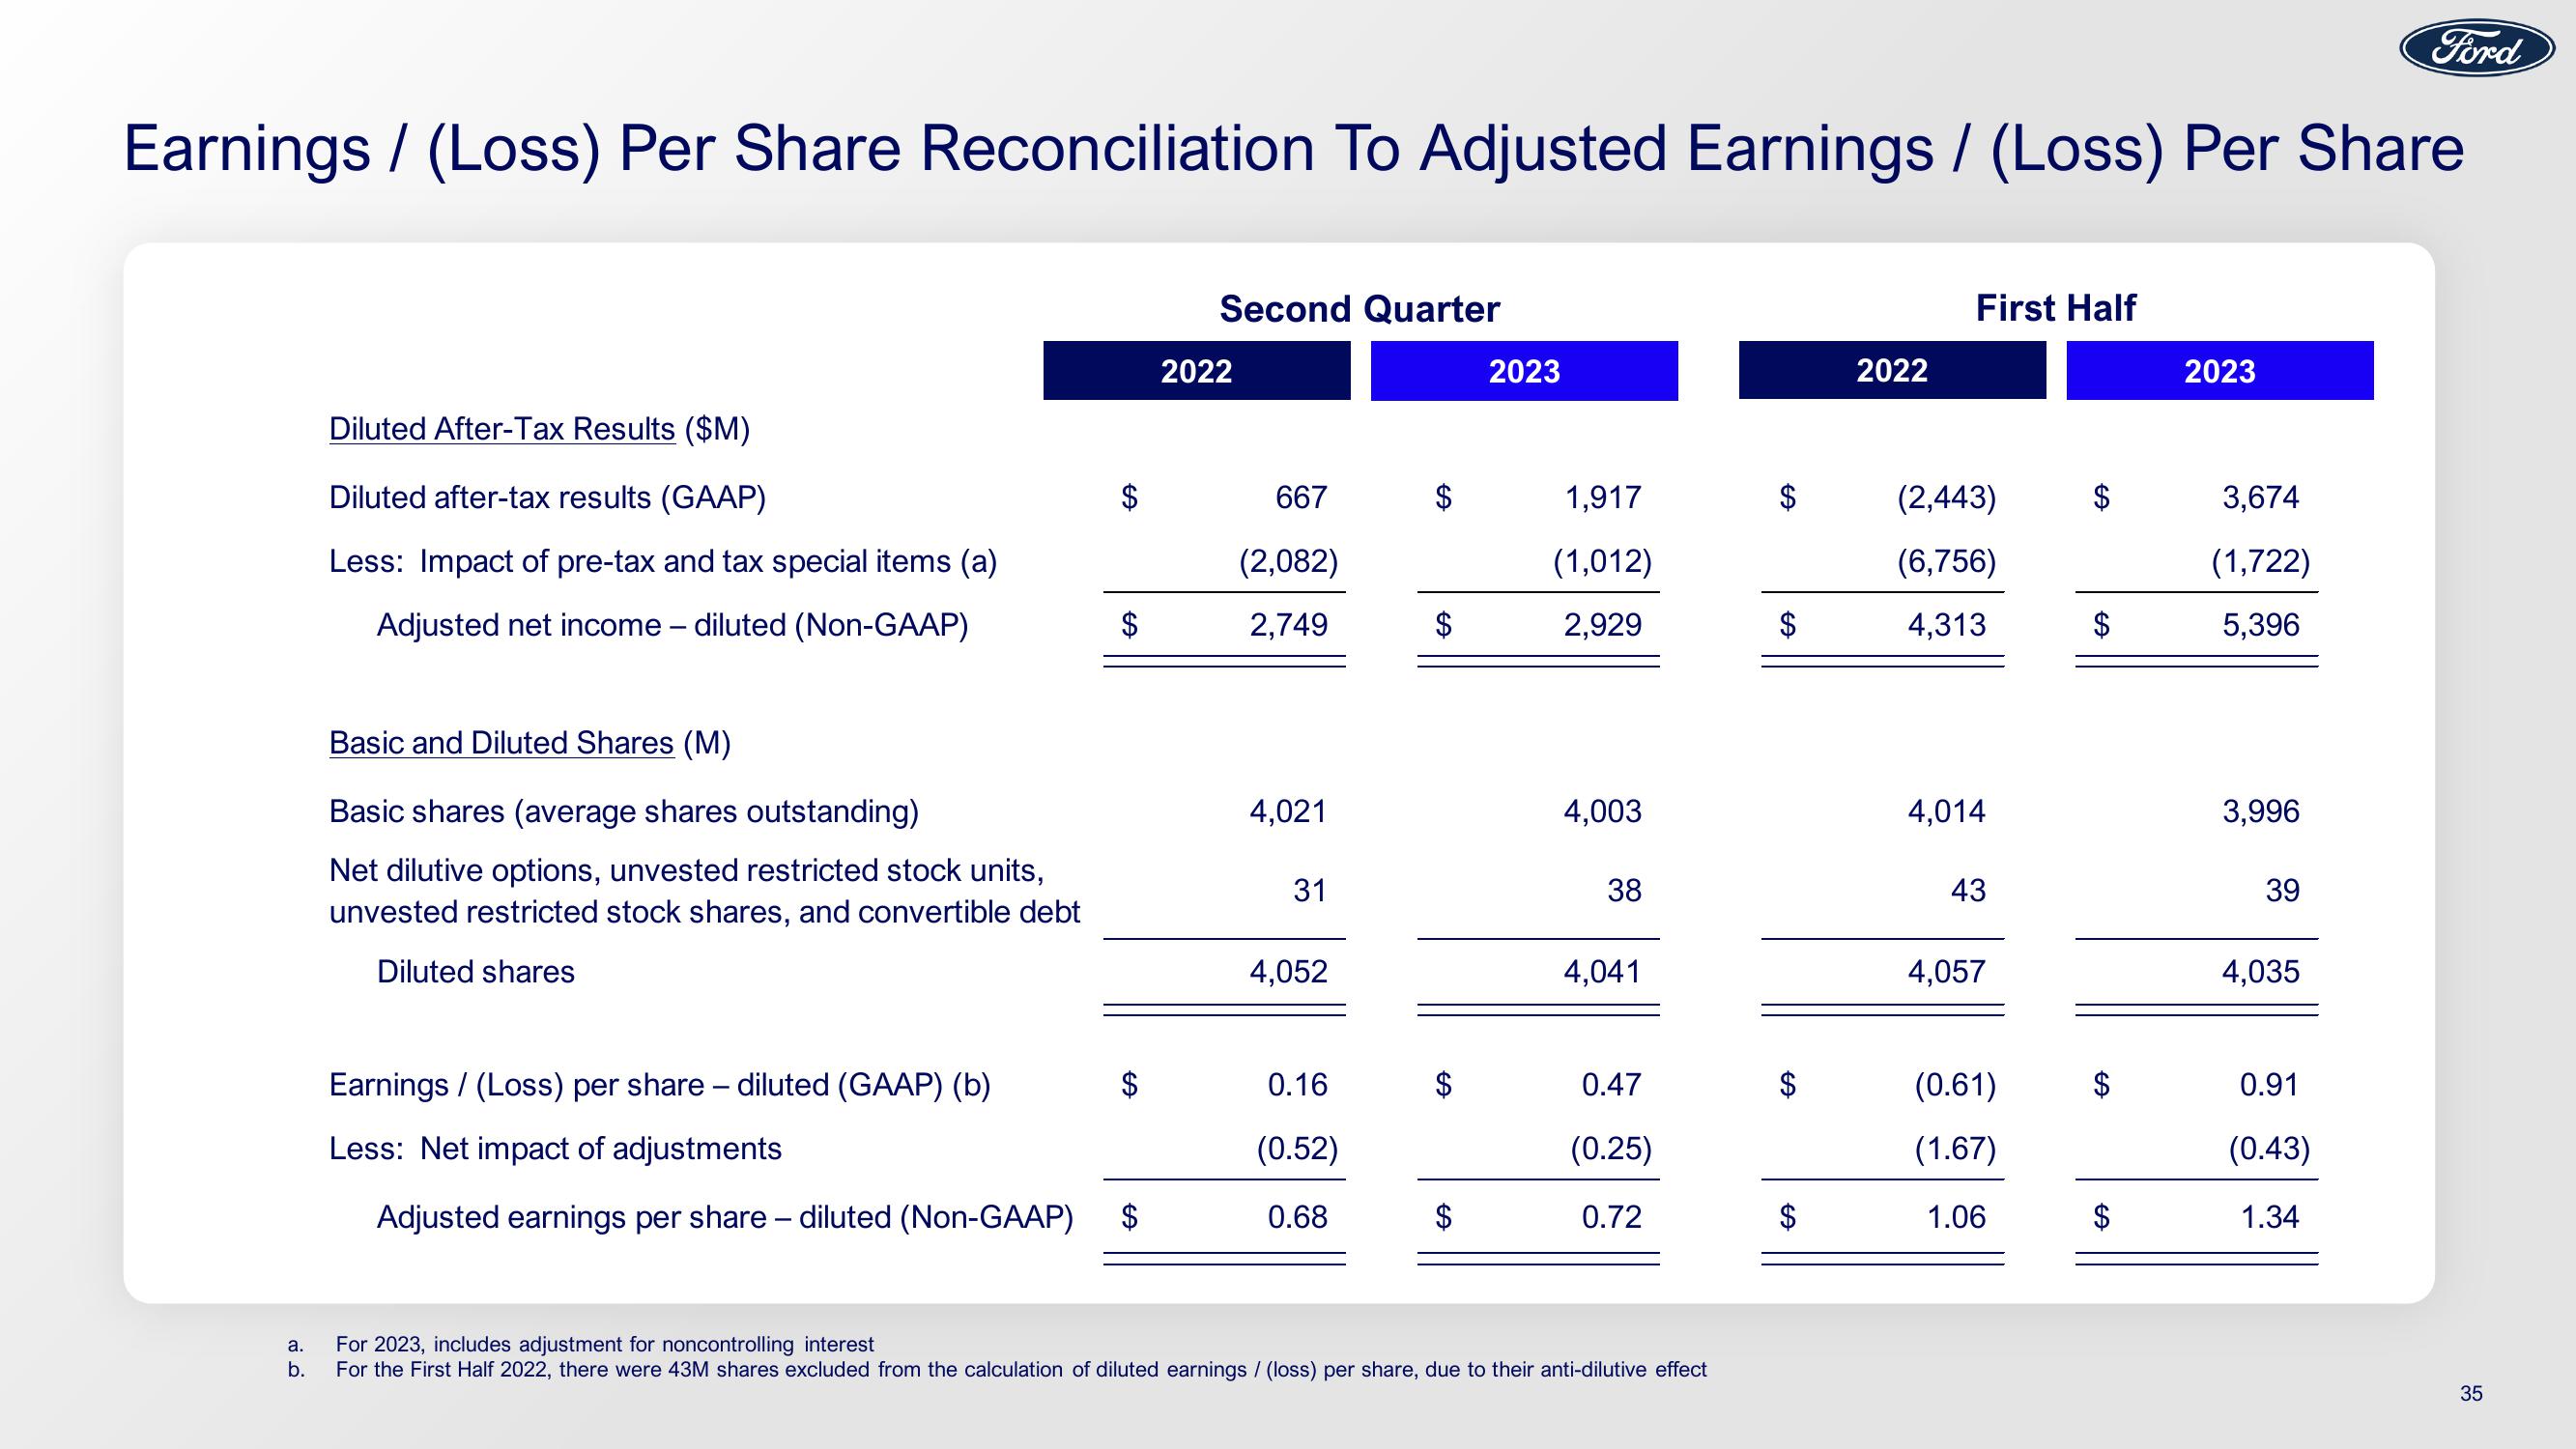
Earnings / (Loss) Per Share Reconciliation To Adjusted Earnings / (Loss) Per Share
a.
b.
Diluted After-Tax Results ($M)
Diluted after-tax results (GAAP)
Less: Impact of pre-tax and tax special items (a)
Adjusted net income - diluted (Non-GAAP)
Basic and Diluted Shares (M)
Basic shares (average shares outstanding)
Net dilutive options, unvested restricted stock units,
unvested restricted stock shares, and convertible debt
Diluted shares
$
Earnings / (Loss) per share - diluted (GAAP) (b)
Less: Net impact of adjustments
Adjusted earnings per share - diluted (Non-GAAP) $
Second Quarter
2022
667
(2,082)
2,749
4,021
31
4,052
0.16
(0.52)
0.68
$
$
$
2023
1,917
(1,012)
2,929
4,003
38
4,041
0.47
(0.25)
0.72
For 2023, includes adjustment for noncontrolling interest
For the First Half 2022, there were 43M shares excluded from the calculation of diluted earnings / (loss) per share, due to their anti-dilutive effect
$
$
GA
2022
First Half
(2,443)
(6,756)
4,313
4,014
43
4,057
(0.61)
(1.67)
1.06
$
$
$
GA
$
2023
3,674
(1,722)
5,396
3,996
39
4,035
Ford
0.91
(0.43)
1.34
35View entire presentation