Avantor Results Presentation Deck
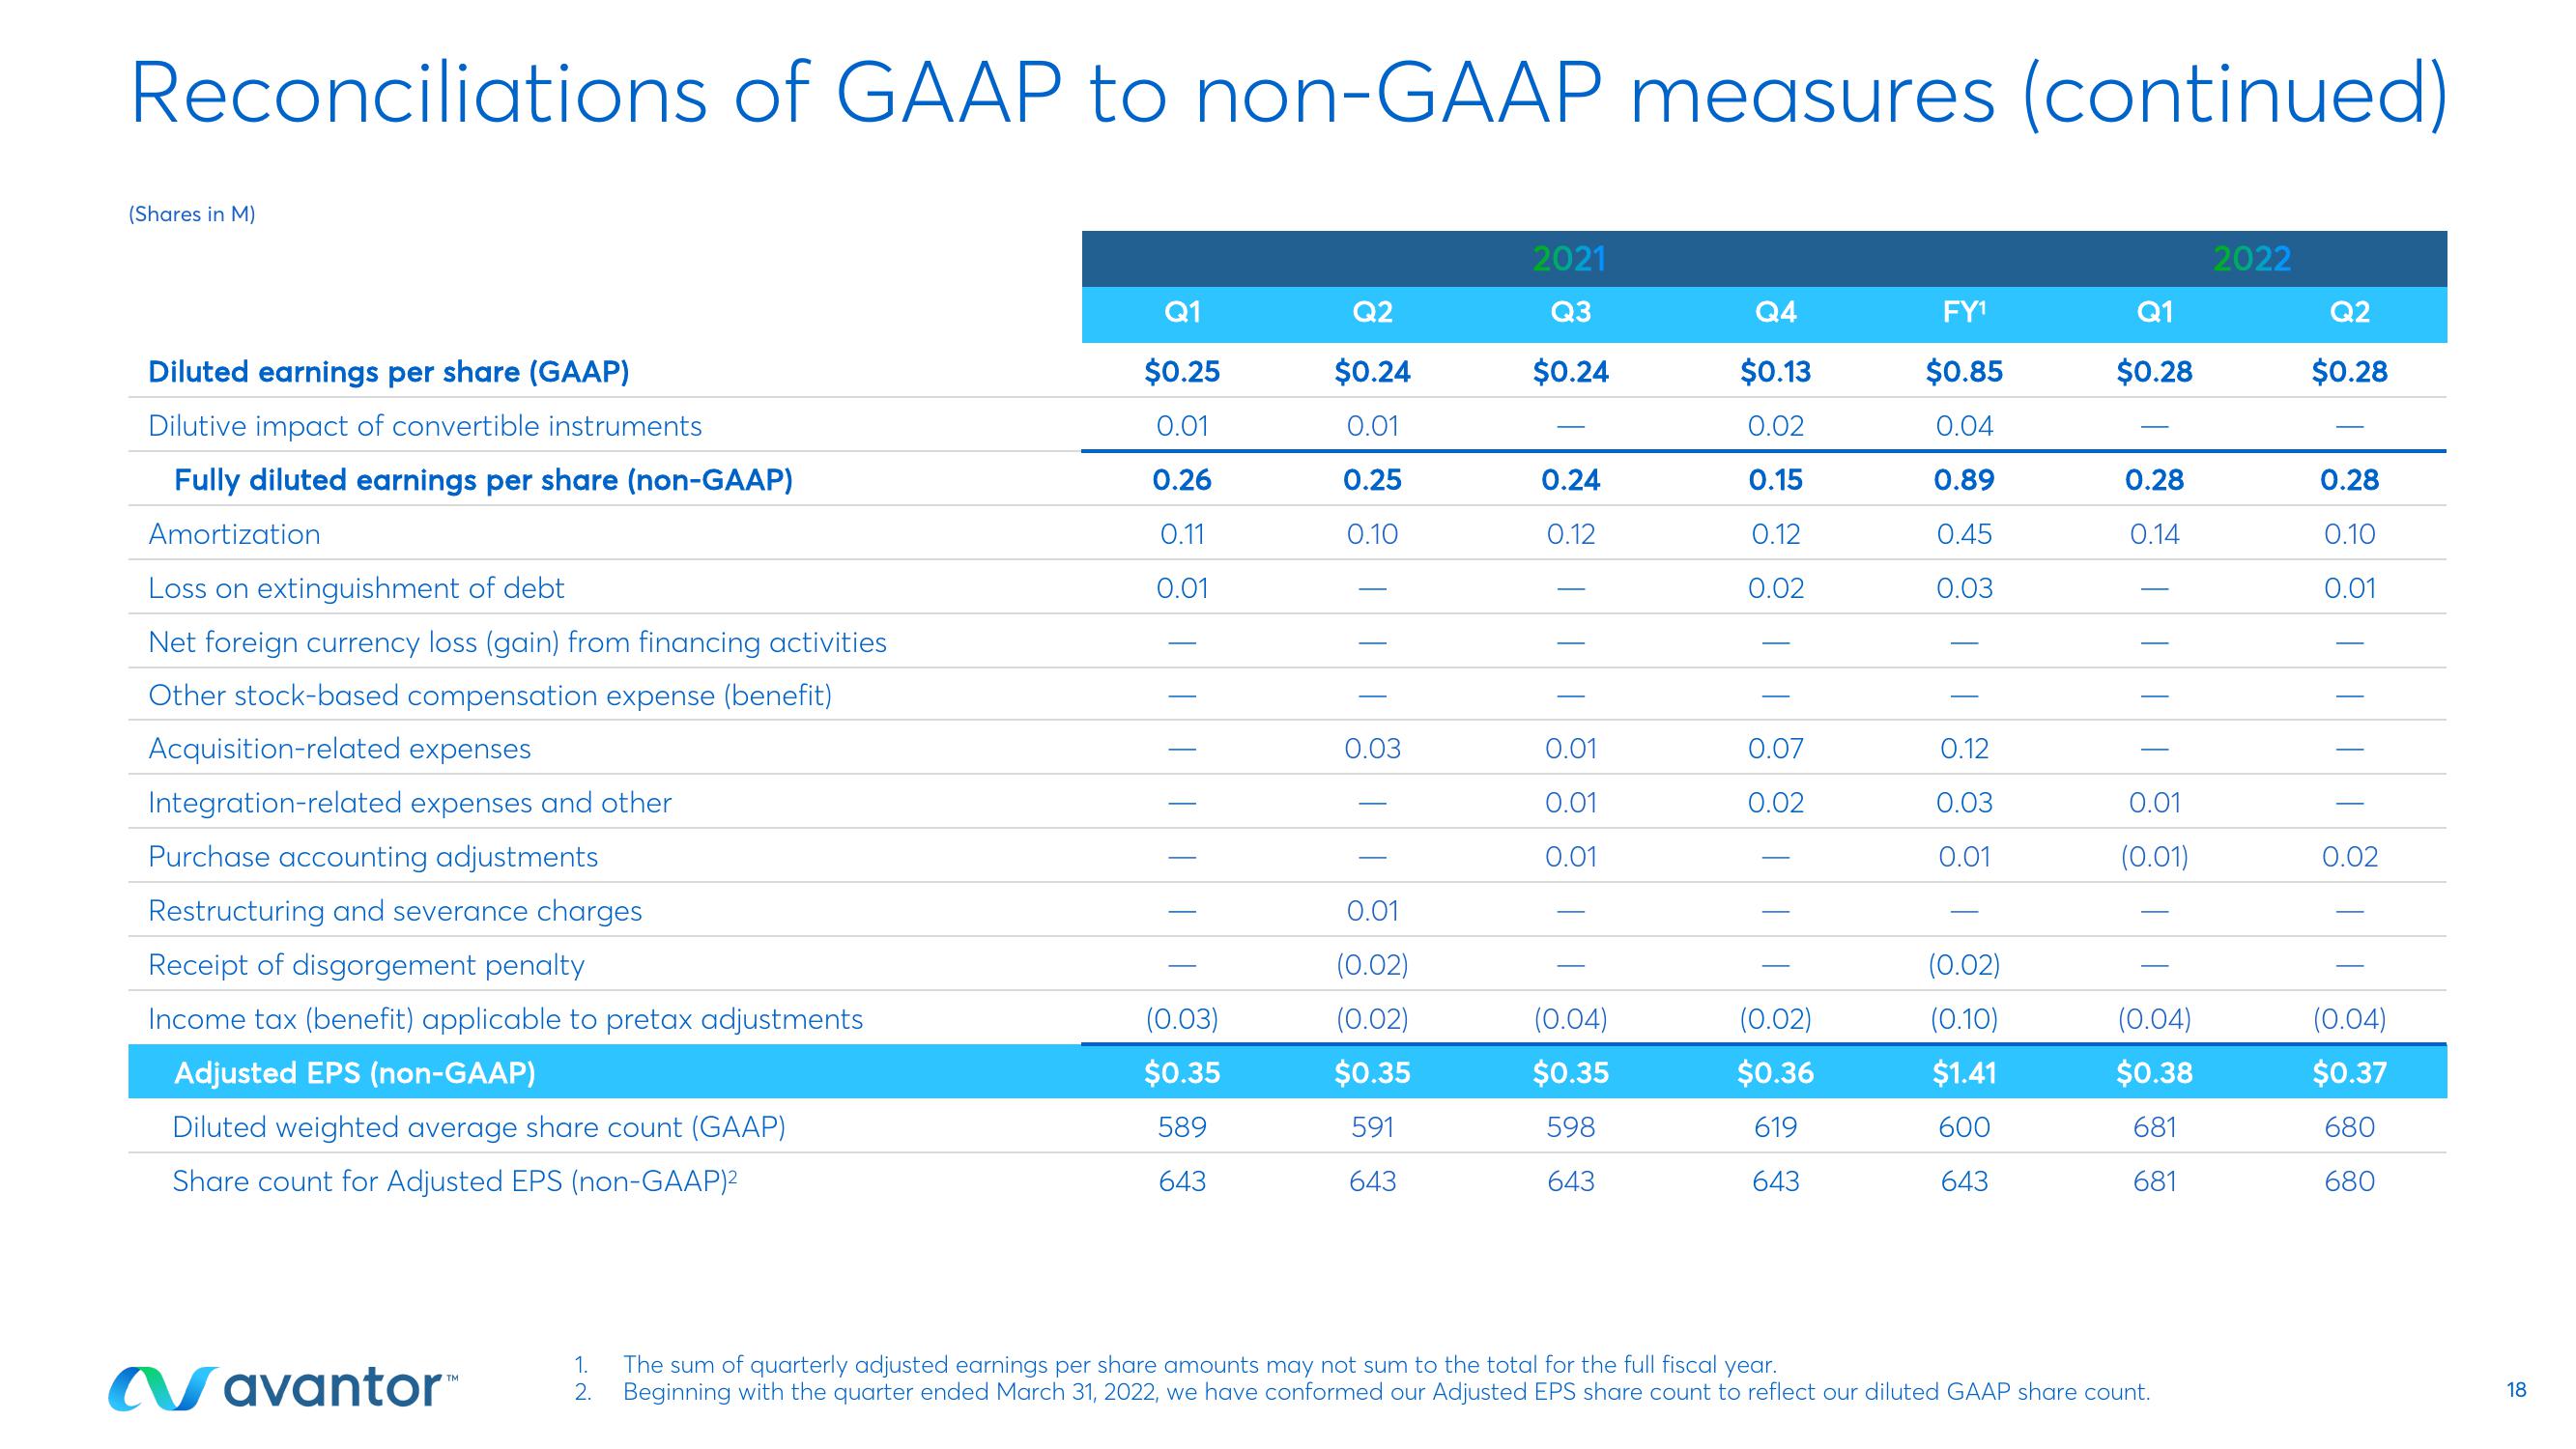
Reconciliations of GAAP to non-GAAP measures (continued)
(Shares in M)
Diluted earnings per share (GAAP)
Dilutive impact of convertible instruments
Fully diluted earnings per share (non-GAAP)
Amortization
Loss on extinguishment of debt
Net foreign currency loss (gain) from financing activities
Other stock-based compensation expense (benefit)
Acquisition-related expenses
Integration-related expenses and other
Purchase accounting adjustments
Restructuring and severance charges
Receipt of disgorgement penalty
Income tax (benefit) applicable to pretax adjustments
Adjusted EPS (non-GAAP)
Diluted weighted average share count (GAAP)
Share count for Adjusted EPS (non-GAAP)²
Navantor™
Q1
$0.25
0.01
0.26
0.11
0.01
(0.03)
$0.35
589
643
Q2
$0.24
0.01
0.25
0.10
0.03
0.01
(0.02)
(0.02)
$0.35
591
643
2021
Q3
$0.24
0.24
0.12
0.01
0.01
0.01
(0.04)
$0.35
598
643
Q4
$0.13
0.02
0.15
0.12
0.02
0.07
0.02
(0.02)
$0.36
619
643
FY¹
$0.85
0.04
0.89
0.45
0.03
0.12
0.03
0.01
(0.02)
(0.10)
$1.41
600
643
Q1
$0.28
0.28
0.14
0.01
(0.01)
(0.04)
$0.38
681
681
1. The sum of quarterly adjusted earnings per share amounts may not sum to the total for the full fiscal year.
2.
Beginning with the quarter ended March 31, 2022, we have conformed our Adjusted EPS share count to reflect our diluted GAAP share count.
2022
Q2
$0.28
0.28
0.10
0.01
||||
0.02
(0.04)
$0.37
680
680
18View entire presentation