Bridge Investment Group Results Presentation Deck
ΤΗ
QUARTER AND FULL YEAR - EARNINGS SUMMARY
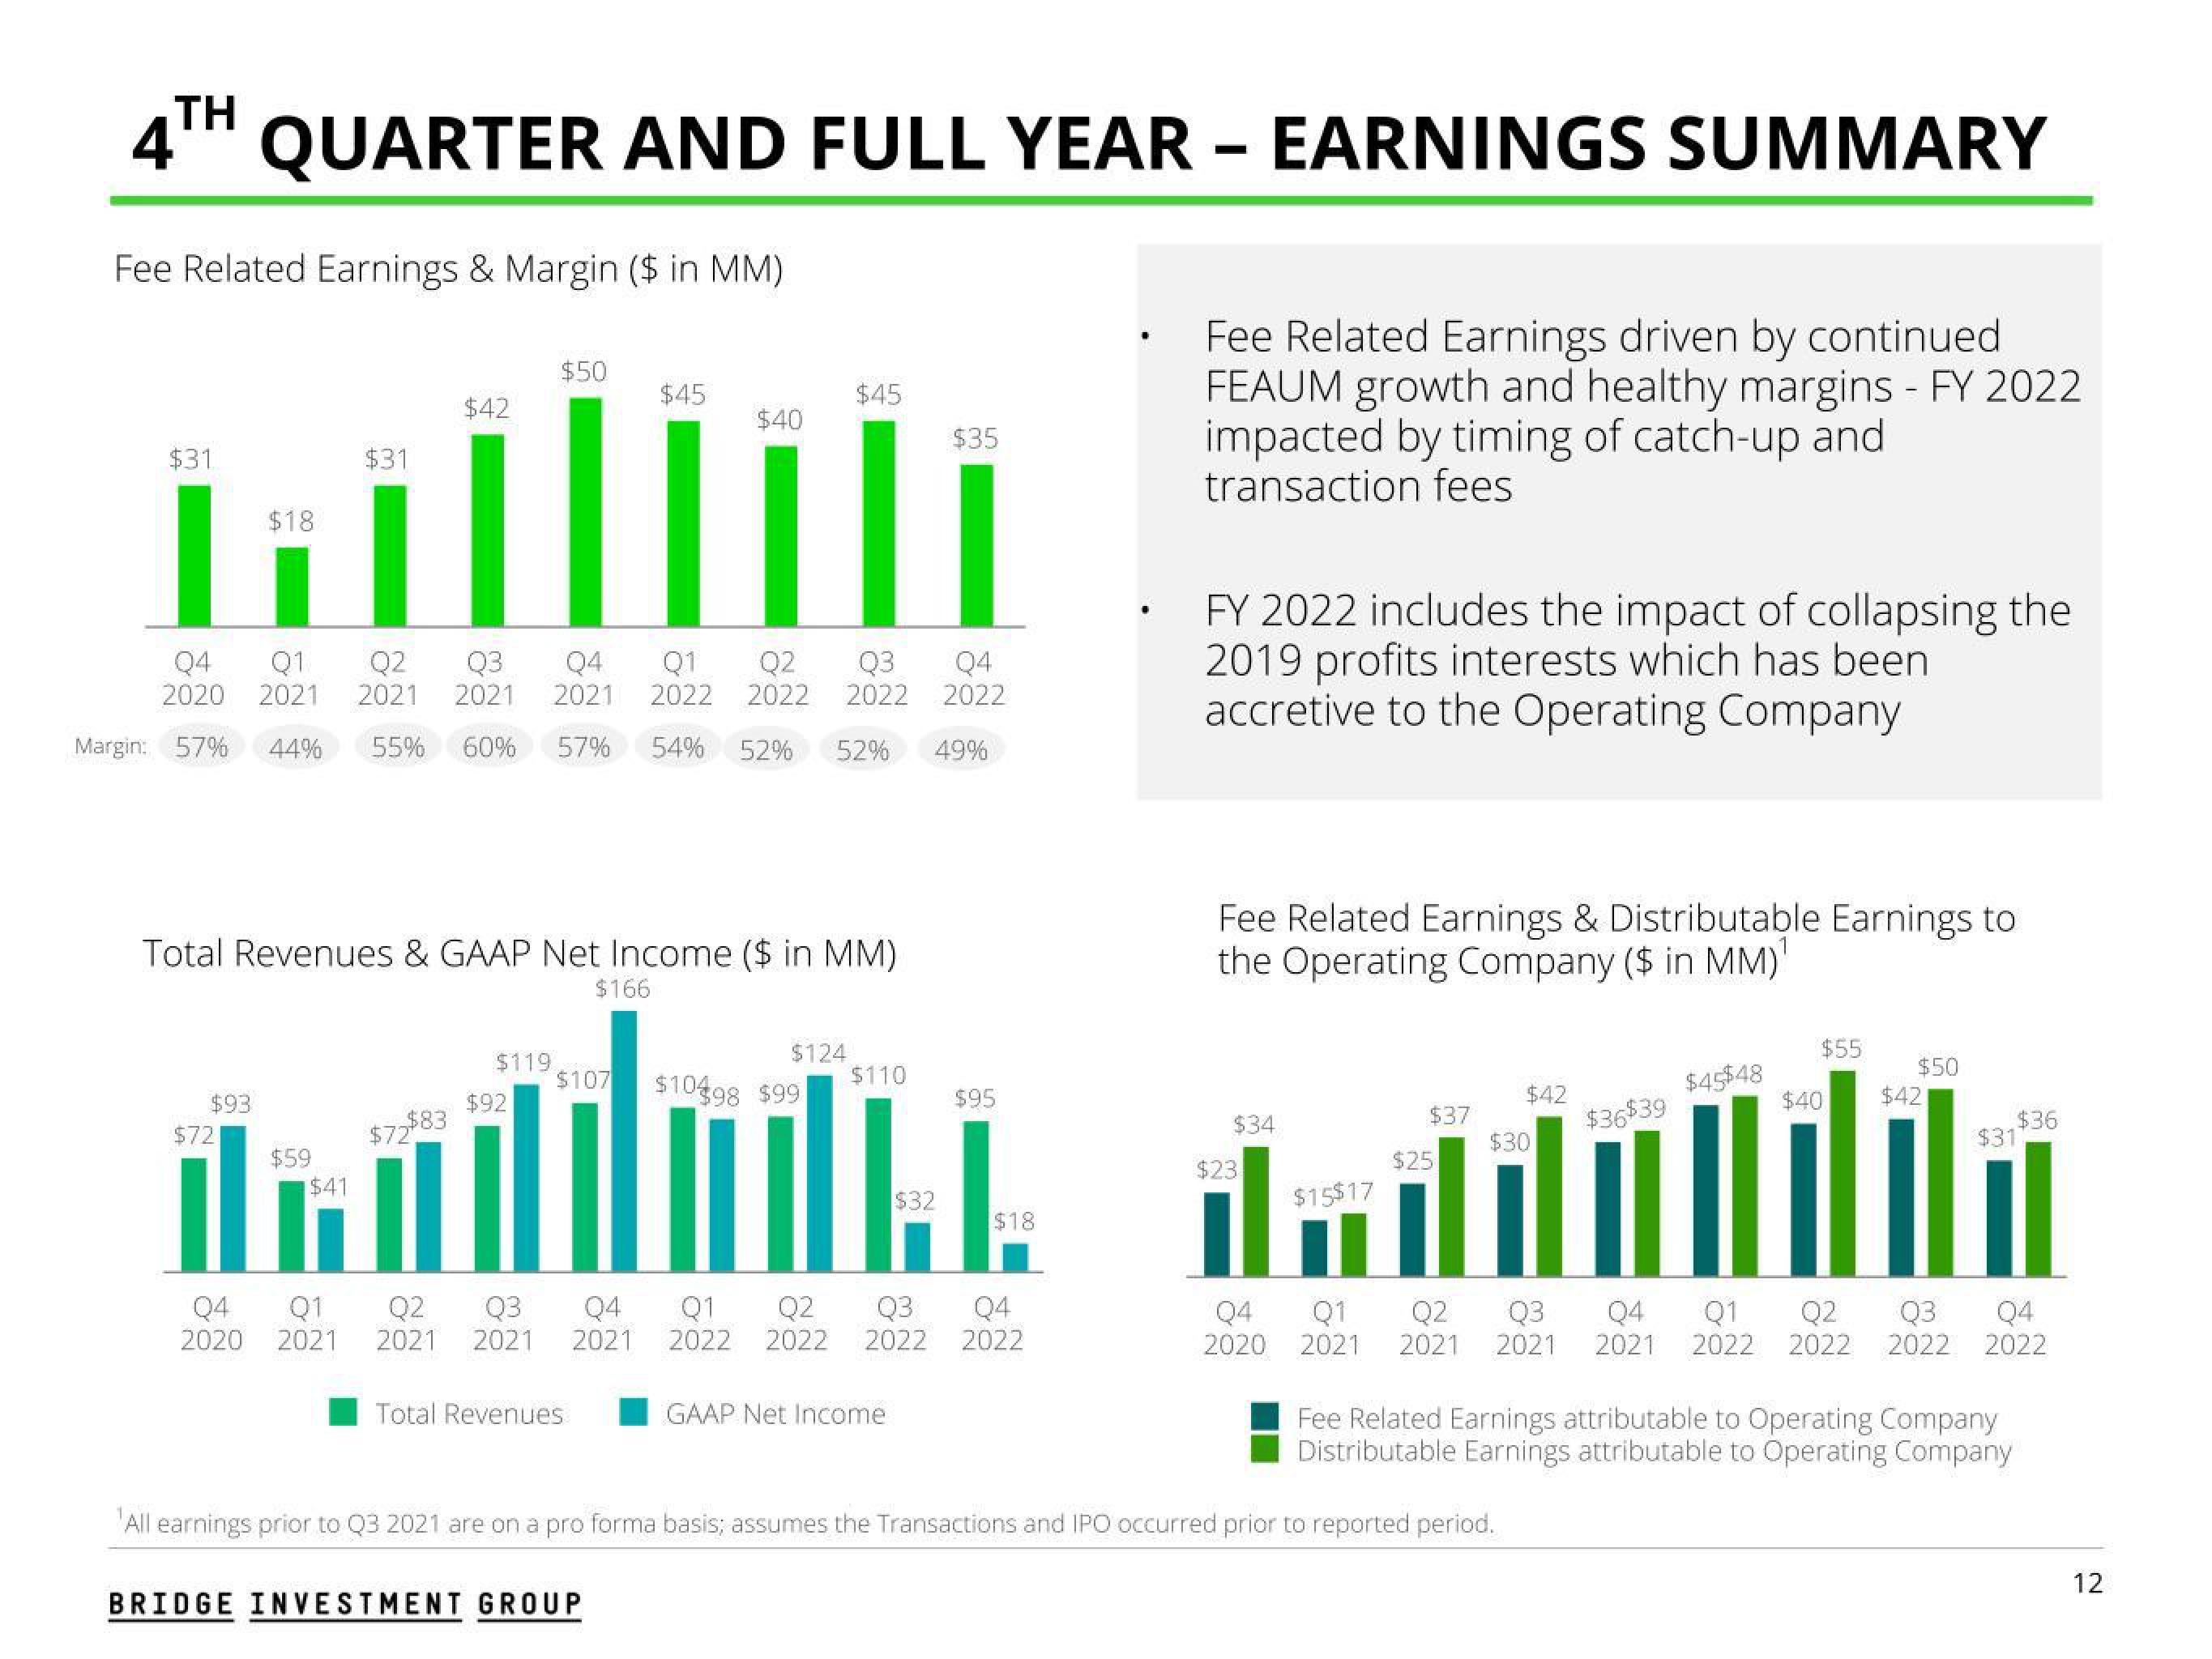
Fee Related Earnings & Margin ($ in MM)
$31
$18
$93
$72
$31
Q4 Q1 Q2 Q3 Q4 Q1 Q2 Q3 Q4
2020 2021 2021 2021 2021 2022 2022 2022 2022
Margin: 57% 44% 55% 60% 57% 54% 52% 52% 49%
$59
Total Revenues & GAAP Net Income ($ in MM)
$41
$42
Q4 Q1
2020 2021
$50
$72$83
$119
$107
$10498 $99
$92
M.
$45
$166
Q2 Q3 Q4
2021 2021 2021
Total Revenues
$45
$40
$35
ill
BRIDGE INVESTMENT GROUP
$124
$110
$32
GAAP Net Income
$95
$18
Q4
Q1 Q2 Q3
2022 2022 2022 2022
Fee Related Earnings driven by continued
FEAUM growth and healthy margins - FY 2022
impacted by timing of catch-up and
transaction fees
FY 2022 includes the impact of collapsing the
2019 profits interests which has been
accretive to the Operating Company
Fee Related Earnings & Distributable Earnings to
the Operating Company ($ in MM)
$34
$23
Q4
2020
$15$17
$37
$25
$42
$30
All earnings prior to Q3 2021 are on a pro forma basis; assumes the Transactions and IPO occurred prior to reported period.
$36$39
$45$48
$55
$40
$50
$42
$36
$31]
Q1 Q2 Q3 Q4 Q1 Q2 Q3 Q4
2021 2021 2021 2021 2022 2022 2022 2022
Fee Related Earnings attributable to Operating Company
Distributable Earnings attributable to Operating Company
12View entire presentation