Gatos Silver Investor Presentation Deck
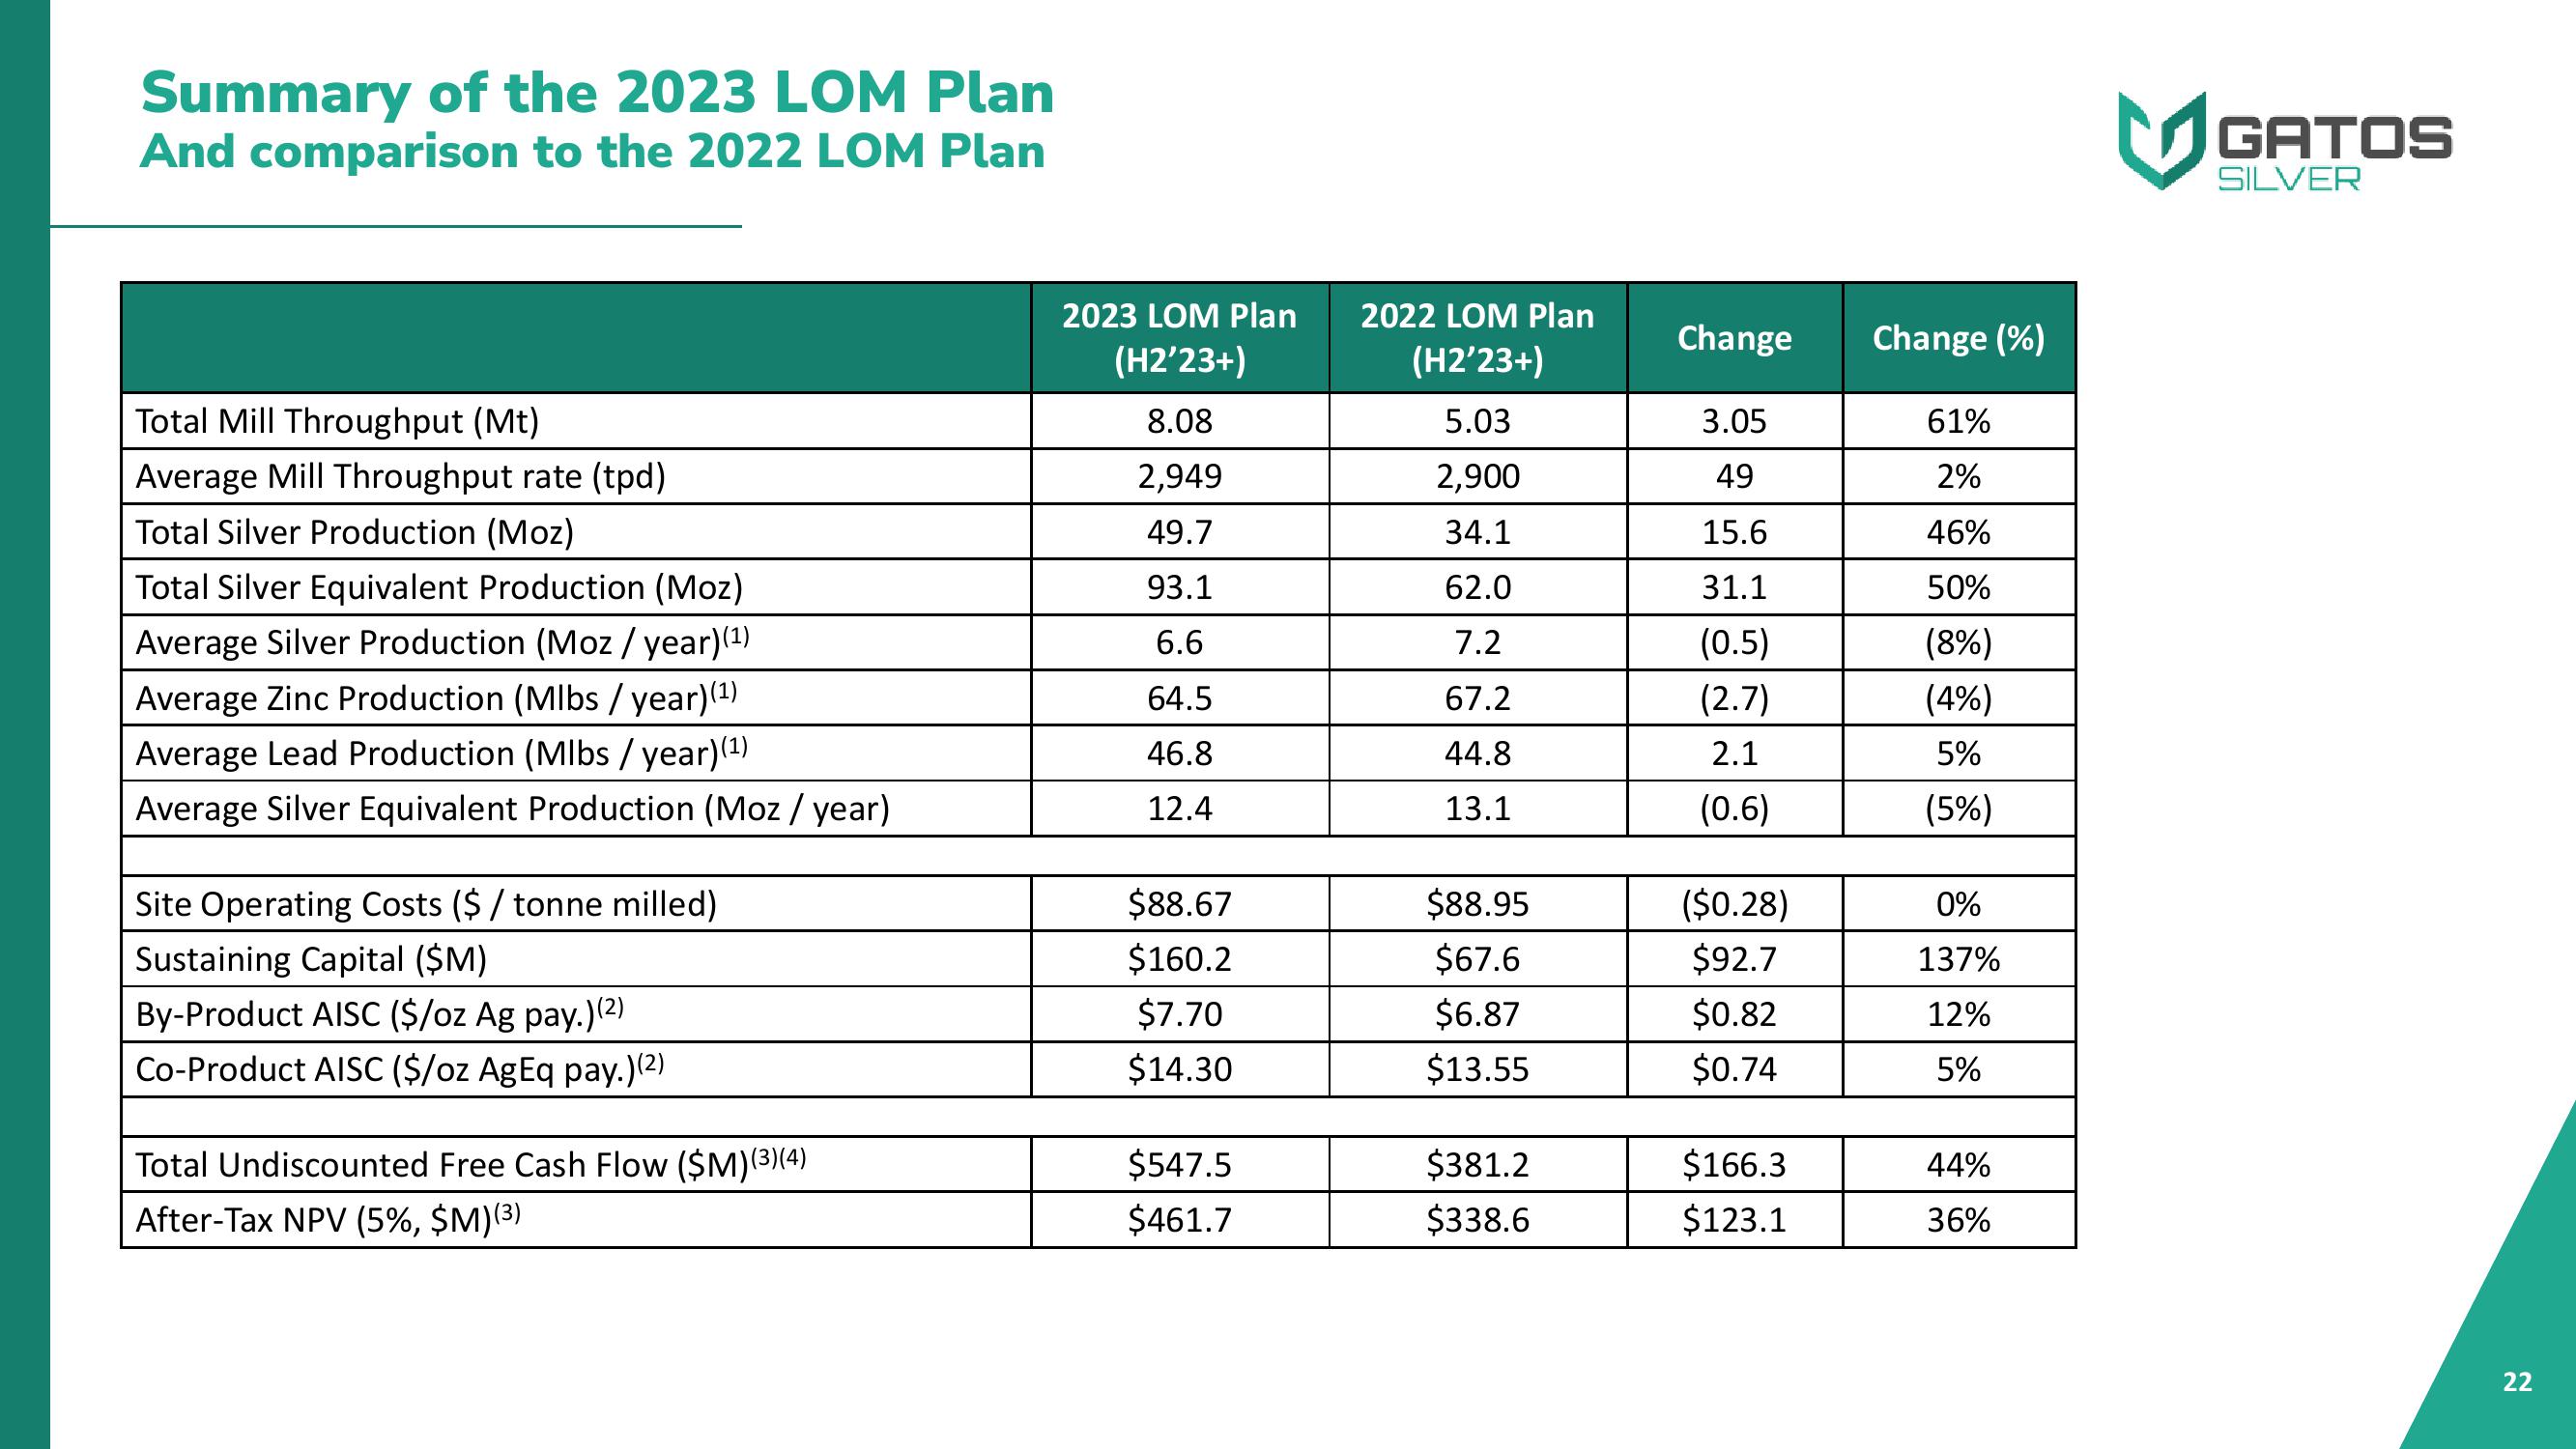
Summary of the 2023 LOM Plan
And comparison to the 2022 LOM Plan
Total Mill Throughput (Mt)
Average Mill Throughput rate (tpd)
Total Silver Production (Moz)
Total Silver Equivalent Production (Moz)
Average Silver Production (Moz/year) (¹)
Average Zinc Production (Mlbs/year) (¹)
Average Lead Production (Mlbs/year) (¹)
Average Silver Equivalent Production (Moz/year)
Site Operating Costs ($/ tonne milled)
Sustaining Capital ($M)
By-Product AISC ($/oz Ag pay.)(2)
Co-Product AISC ($/oz AgEq pay.)(2)
Total Undiscounted Free Cash Flow ($M)(3)(4)
After-Tax NPV (5%, $M) (³)
2023 LOM Plan
(H2'23+)
8.08
2,949
49.7
93.1
6.6
64.5
46.8
12.4
$88.67
$160.2
$7.70
$14.30
$547.5
$461.7
2022 LOM Plan
(H2'23+)
5.03
2,900
34.1
62.0
7.2
67.2
44.8
13.1
$88.95
$67.6
$6.87
$13.55
$381.2
$338.6
Change
3.05
49
15.6
31.1
(0.5)
(2.7)
2.1
(0.6)
($0.28)
$92.7
$0.82
$0.74
$166.3
$123.1
Change (%)
61%
2%
46%
50%
(8%)
(4%)
5%
(5%)
0%
137%
12%
5%
44%
36%
GATOS
SILVER
22View entire presentation