Investor Presentation
Nextracker's Footprint vs Total Available Market (TAM)
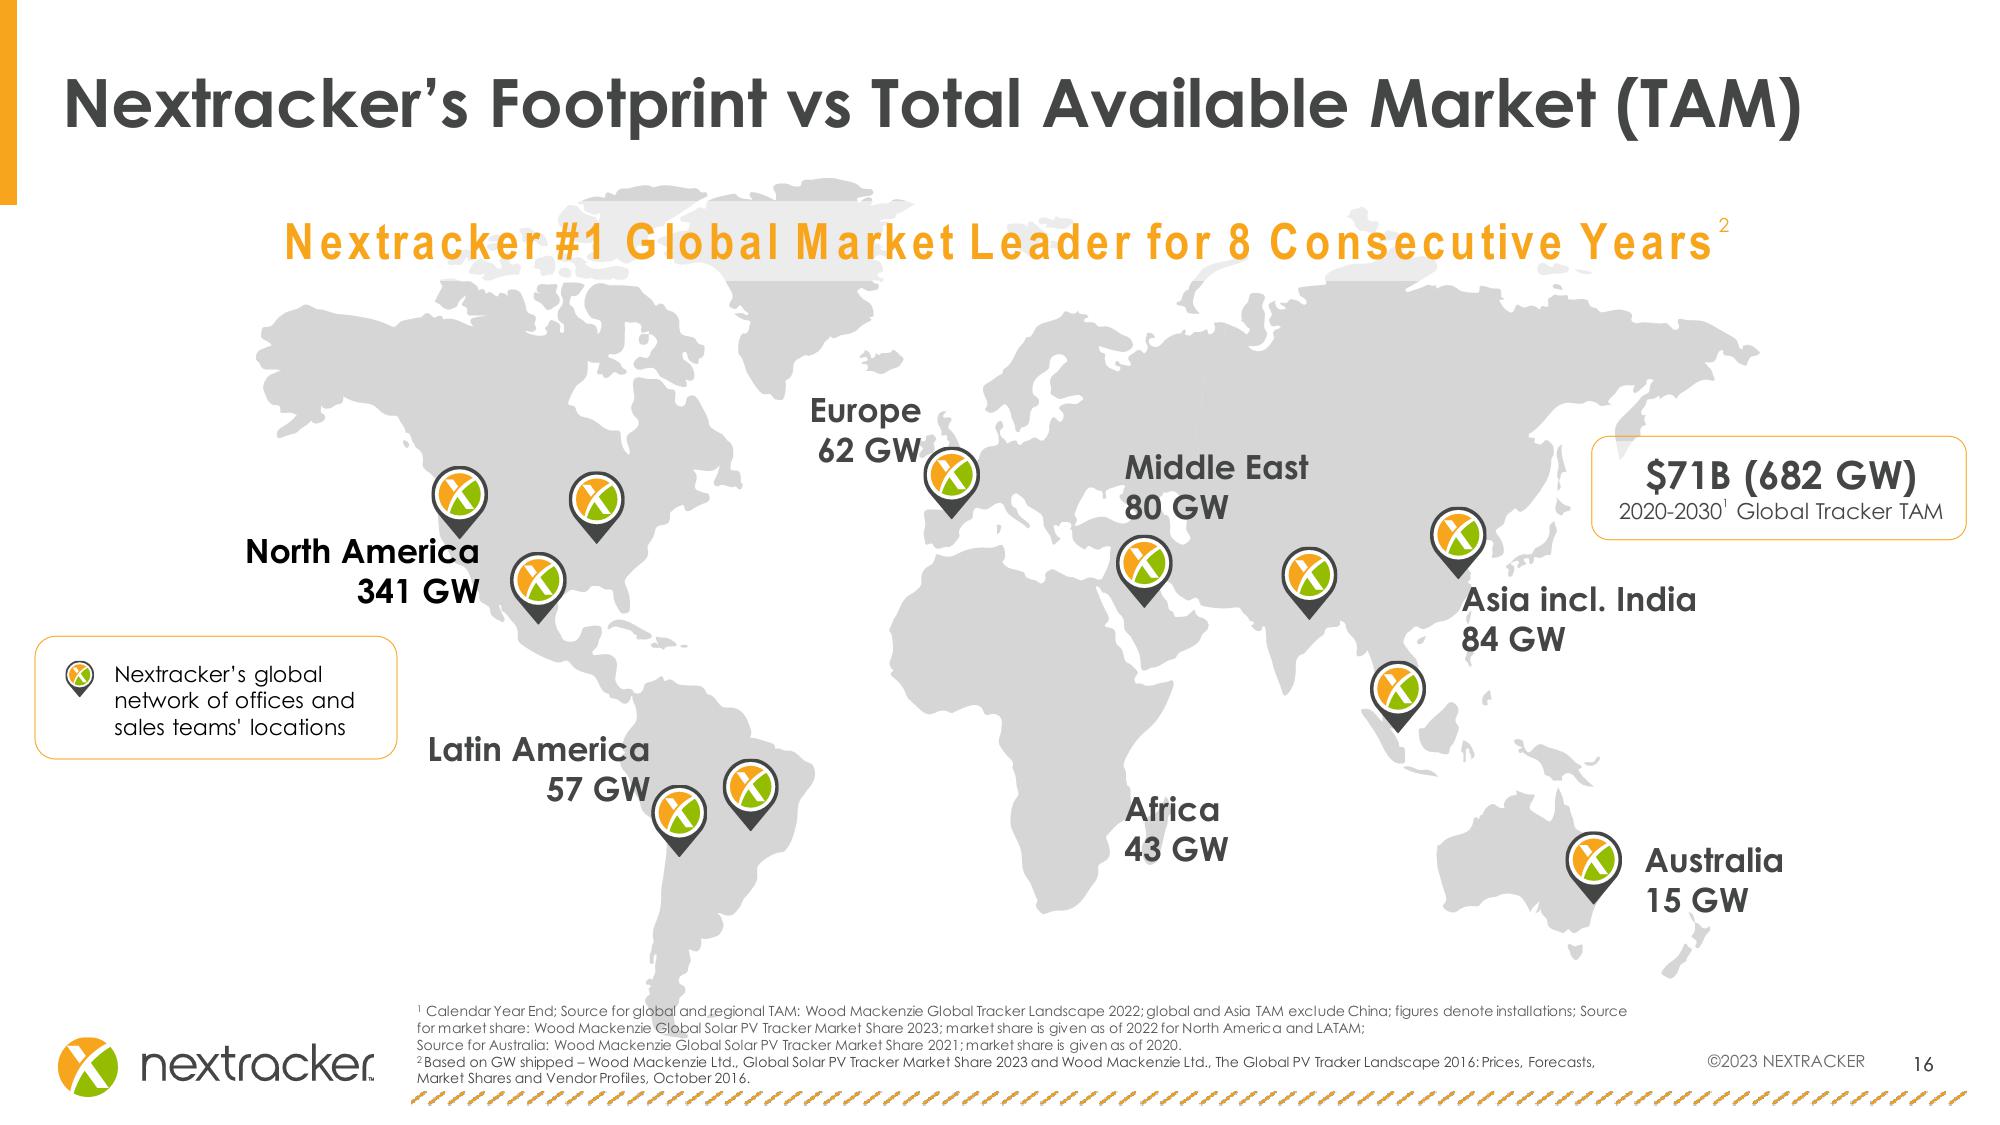
Nextracker #1 Global Market Leader for 8 Consecutive Years2
North America
341 GW
Nextracker's global
network of offices and
sales teams' locations
Latin America
57 GW
nextracker.
Europe
62 GW
Middle East
80 GW
K
Africa
43 GW
$71B (682 GW)
2020-2030 Global Tracker TAM
Asia incl. India
84 GW
1 Calendar Year End; Source for global and regional TAM: Wood Mackenzie Global Tracker Landscape 2022; global and Asia TAM exclude China; figures denote installations; Source
for market share: Wood Mackenzie Global Solar PV Tracker Market Share 2023; market share is given as of 2022 for North America and LATAM;
Source for Australia: Wood Mackenzie Global Solar PV Tracker Market Share 2021; market share is given as of 2020.
2Based on GW shipped - Wood Mackenzie Ltd., Global Solar PV Tracker Market Share 2023 and Wood Mackenzie Ltd., The Global PV Tracker Landscape 2016: Prices, Forecasts,
Market Shares and Vendor Profiles, October 2016.
Australia
15 GW
©2023 NEXTRACKER
16View entire presentation