LanzaTech SPAC Presentation Deck
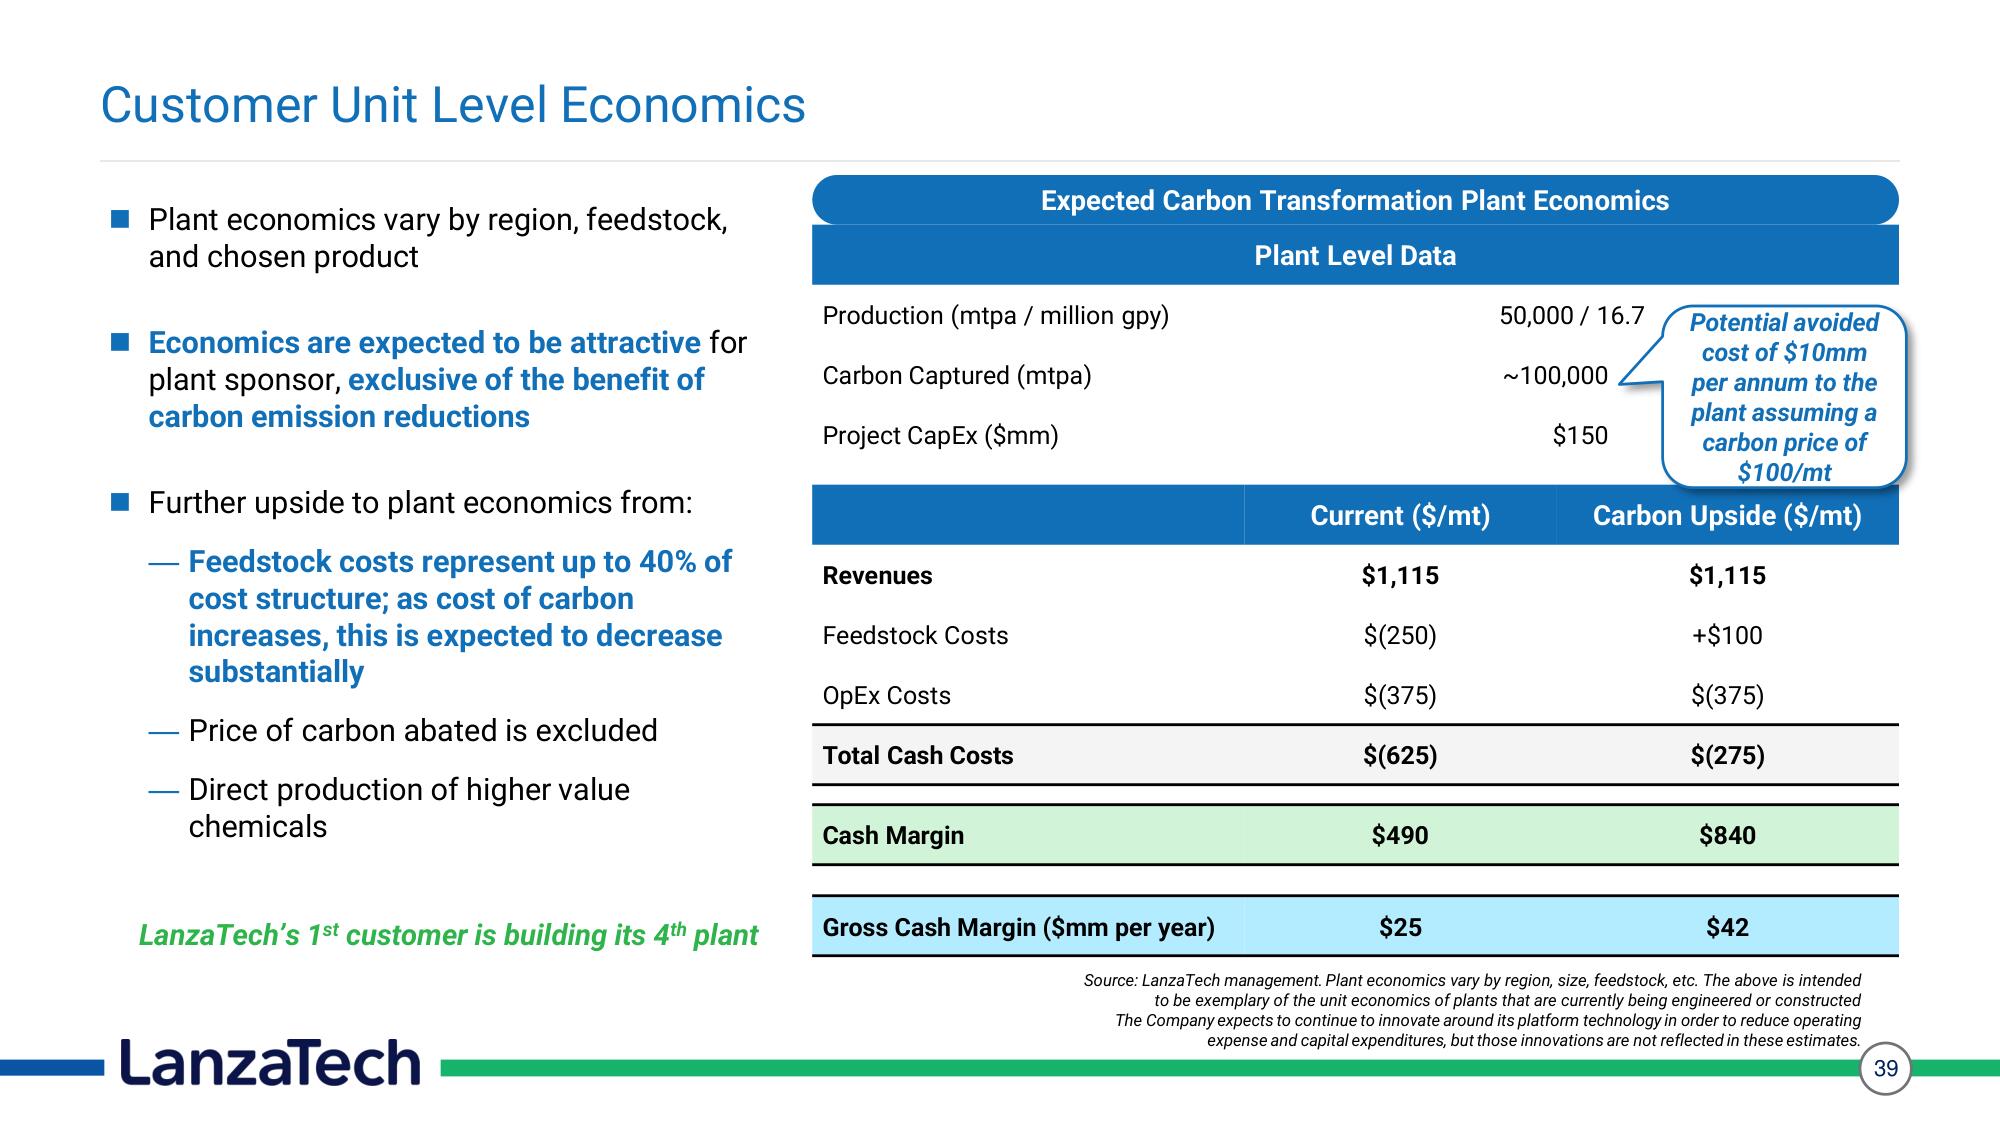
Customer Unit Level Economics
Plant economics vary by region, feedstock,
and chosen product
Economics are expected to be attractive for
plant sponsor, exclusive of the benefit of
carbon emission reductions
Further upside to plant economics from:
Feedstock costs represent up to 40% of
cost structure; as cost of carbon
increases, this is expected to decrease
substantially
Price of carbon abated is excluded
Direct production of higher value
chemicals
LanzaTech's 1st customer is building its 4th plant
LanzaTech
Production (mtpa / million gpy)
Carbon Captured (mtpa)
Project CapEx ($mm)
Revenues
Feedstock Costs
OpEx Costs
Total Cash Costs
Expected Carbon Transformation Plant Economics
Plant Level Data
Cash Margin
Gross Cash Margin ($mm per year)
Current ($/mt)
$1,115
$(250)
$(375)
$(625)
$490
$25
50,000/ 16.7
~100,000
Potential avoided
cost of $10mm
per annum to the
plant assuming a
carbon price of
$100/mt
Carbon Upside ($/mt)
$1,115
+$100
$(375)
$(275)
$150
$840
$42
Source: LanzaTech management. Plant economics vary by region, size, feedstock, etc. The above is intended
to be exemplary of the unit economics of plants that are currently being engineered or constructed
The Company expects to continue to innovate around its platform technology in order to reduce operating
expense and capital expenditures, but those innovations are not reflected in these estimates.
39View entire presentation