Apollo Global Management Investor Presentation Deck
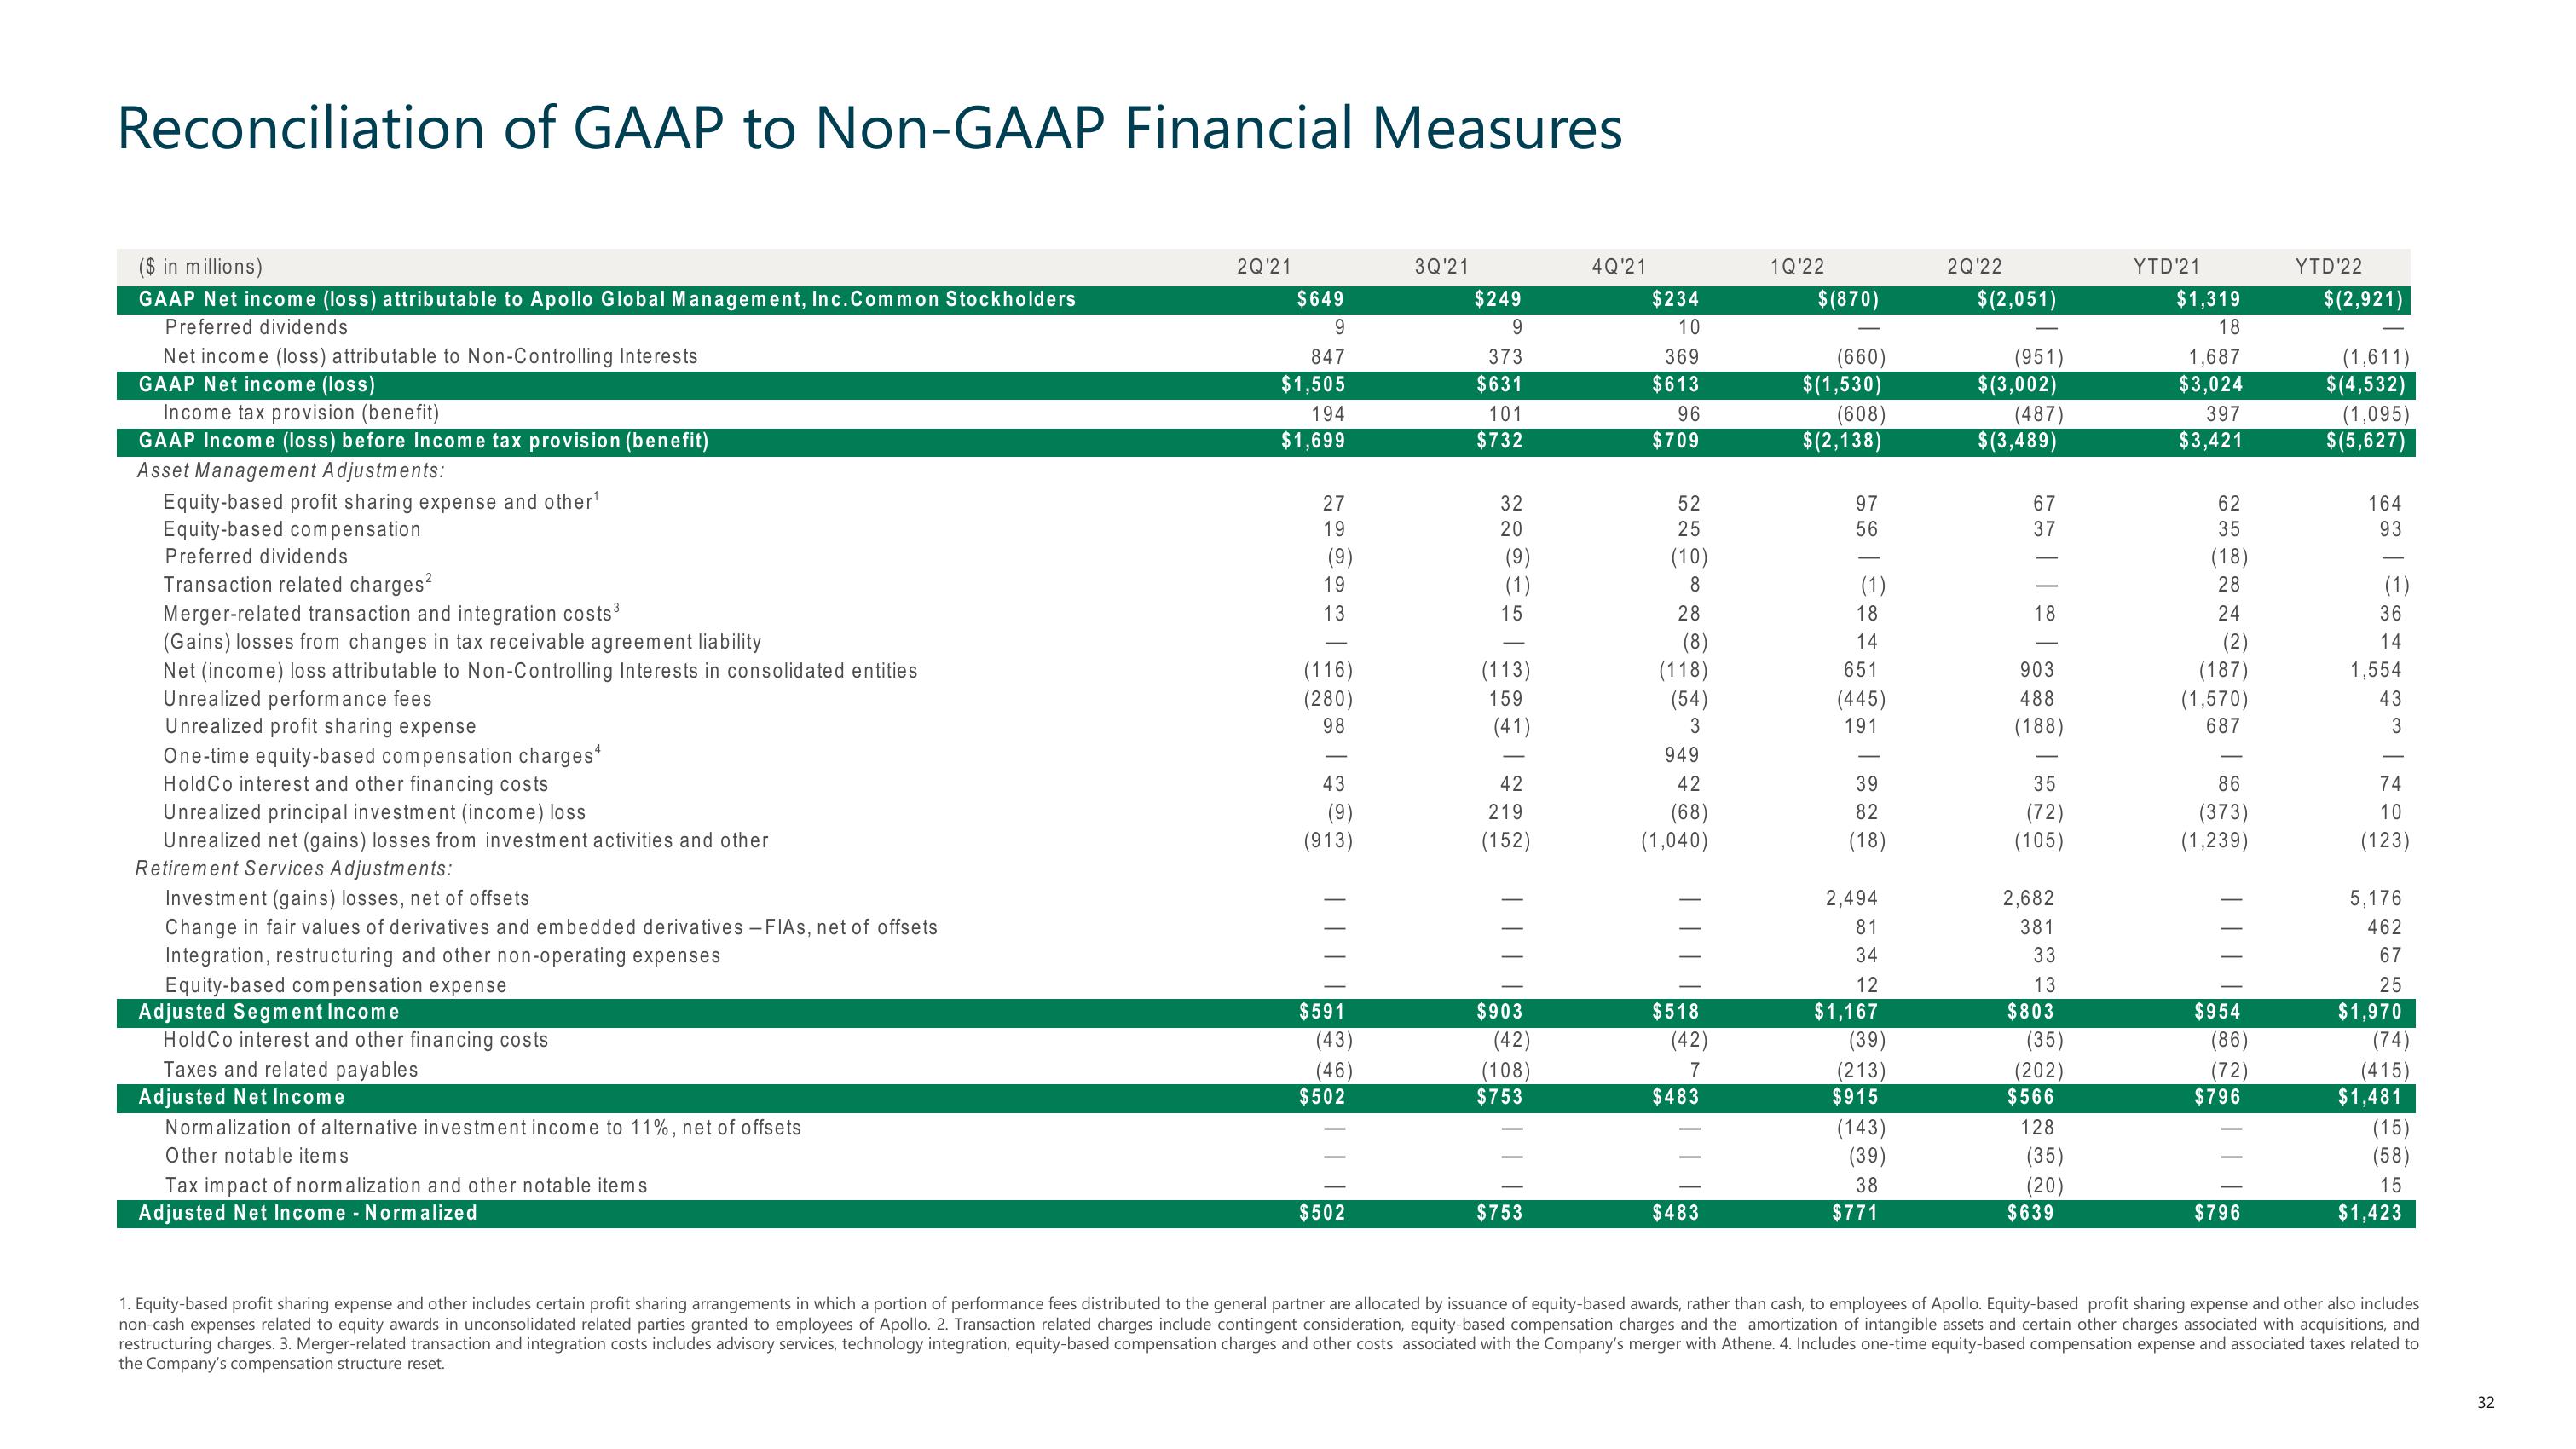
Reconciliation of GAAP to Non-GAAP Financial Measures
($ in millions)
GAAP Net income (loss) attributable to Apollo Global Management, Inc. Common Stockholders
Preferred dividends
Net income (loss) attributable to Non-Controlling Interests
GAAP Net income (loss)
Income tax provision (benefit)
GAAP Income (loss) before Income tax provision (benefit)
Asset Management Adjustments:
Equity-based profit sharing expense and other¹
Equity-based compensation
Preferred dividends
Transaction related charges²
Merger-related transaction and integration costs³
3
(Gains) losses from changes in tax receivable agreement liability
Net (income) loss attributable to Non-Controlling Interests in consolidated entities
Unrealized performance fees
Unrealized profit sharing expense
One-time equity-based compensation charges4
Hold Co interest and other financing costs
Unrealized principal investment (income) loss
Unrealized net (gains) losses from investment activities and other
Retirement Services Adjustments:
Investment (gains) losses, net of offsets
Change in fair values of derivatives and embedded derivatives - FIAS, net of offsets
Integration, restructuring and other non-operating expenses
Equity-based compensation expense
Adjusted Segment Income
Hold Co interest and other financing costs
Taxes and related payables
Adjusted Net Income
Normalization of alternative investment income to 11%, net of offsets
Other notable items
Tax impact of normalization and other notable items
Adjusted Net Income - Normalized
2Q¹21
$649
9
847
$1,505
194
$1,699
27
19
(9)
19
13
(116)
(280)
98
43
(9)
(913)
$591
(43)
(46)
$50
||
$502
3Q'21
$249
9
373
$631
101
$732
32
20
(9)
(1)
15
(113)
159
(41)
42
219
(152)
$903
(42)
(108)
$75
$753
4Q'21
$234
10
369
$613
96
$709
52
25
(10)
8
28
(8)
(118)
(54)
3
949
42
(68)
(1,040)
$518
(42)
7
$483
$483
1Q'22
$(870)
(660)
$(1,530)
(608)
$(2,138)
97
56
(1)
18
14
651
(445)
191
39
82
(18)
2,494
81
34
12
$1,167
(39)
(213)
$915
(143)
(39)
38
$771
2Q'22
$(2,051)
(951)
$ (3,002)
(487)
$ (3,489)
67
37
18
903
488
(188)
35
(72)
(105)
2,682
381
33
13
$803
(35)
(202)
566
128
(35)
(20)
$639
YTD'21
$1,319
18
1,687
$3,024
397
$3,421
62
35
(18)
28
24
(2)
(187)
(1,570)
687
86
(373)
(1,239)
$954
(86)
(72)
$796
$796
YTD¹22
$(2,921)
(1,611)
$(4,532)
(1,095)
$(5,627)
164
93
(1)
36
14
1,554
43
3
74
10
(123)
5,176
462
67
25
$1,970
(74)
(415)
$1,481
(15)
(58)
15
$1,423
1. Equity-based profit sharing expense and other includes certain profit sharing arrangements in which a portion of performance fees distributed to the general partner are allocated by issuance of equity-based awards, rather than cash, to employees of Apollo. Equity-based profit sharing expense and other also includes
non-cash expenses related to equity awards in unconsolidated related parties granted to employees of Apollo. 2. Transaction related charges include contingent consideration, equity-based compensation charges and the amortization of intangible assets and certain other charges associated with acquisitions, and
restructuring charges. 3. Merger-related transaction and integration costs includes advisory services, technology integration, equity-based compensation charges and other costs associated with the Company's merger with Athene. 4. Includes one-time equity-based compensation expense and associated taxes related to
the Company's compensation structure reset.
32View entire presentation