Origo Results Presentation Deck
✓
✓
✓
Income Statement Q3 2021
- Increase in EBITDA and Continued Strong Revenue Growth
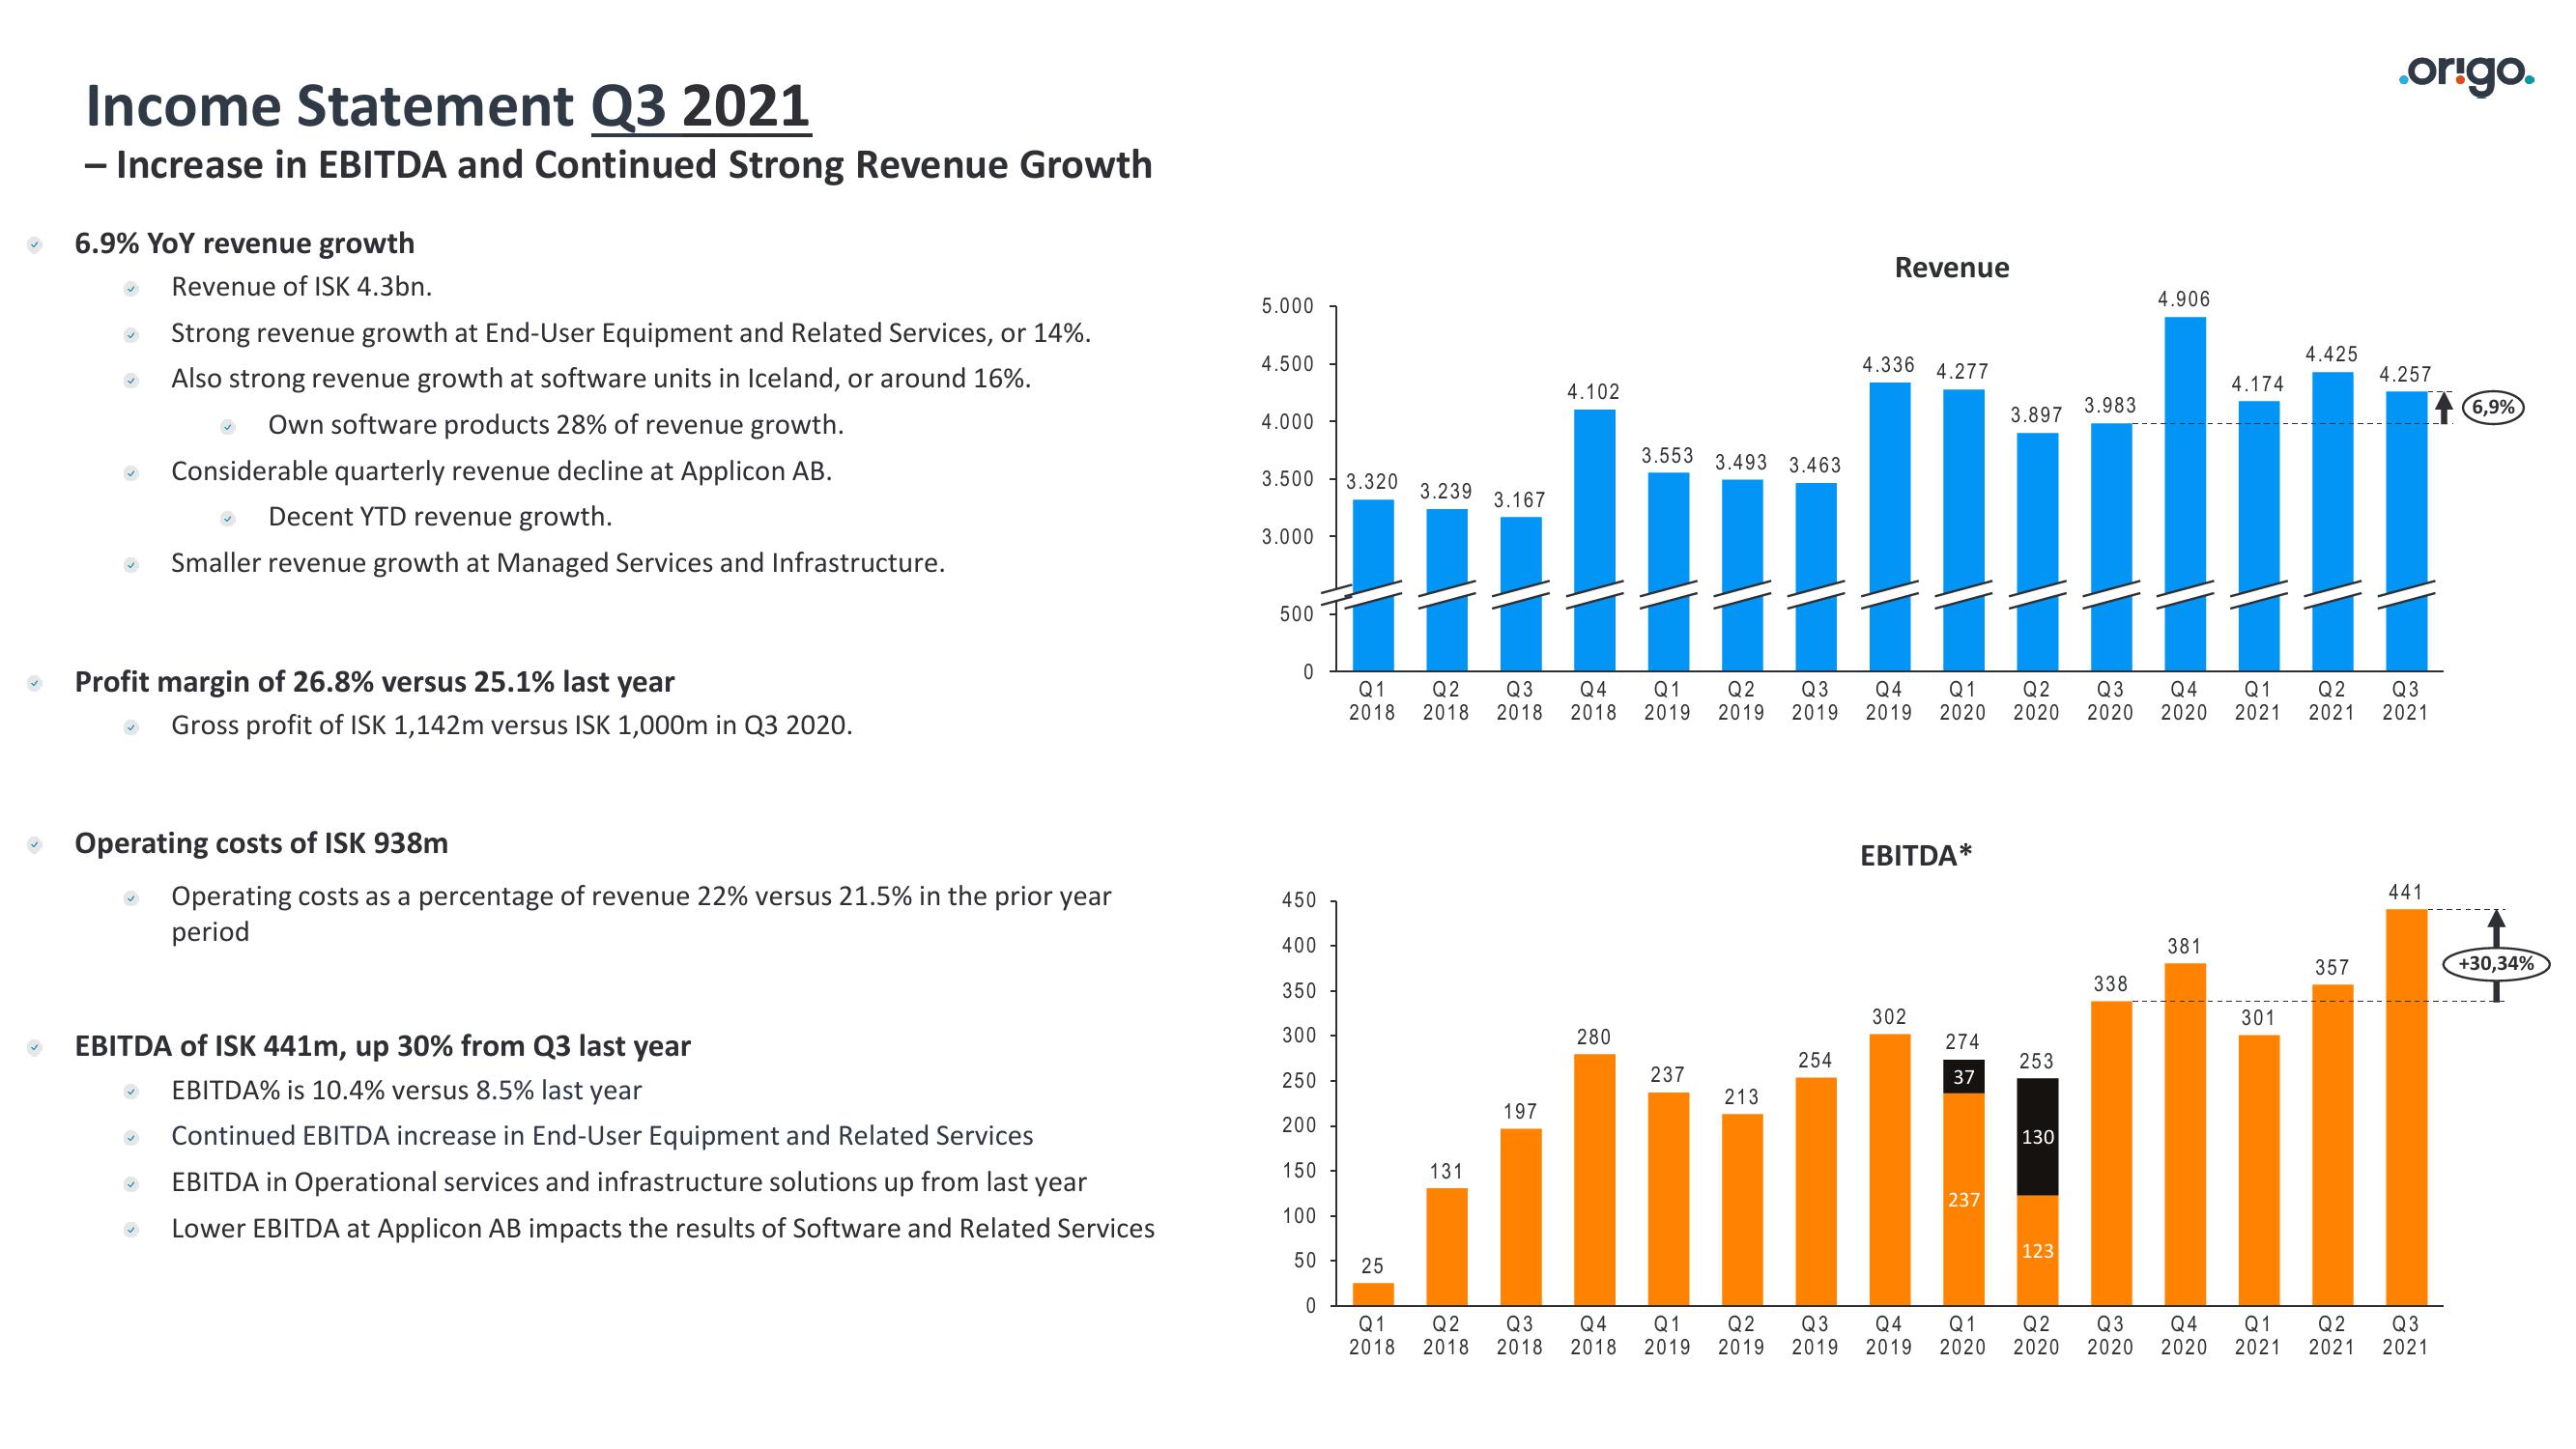
6.9% YoY revenue growth
Revenue of ISK 4.3bn.
Strong revenue growth at End-User Equipment and Related Services, or 14%.
Also strong revenue growth at software units in Iceland, or around 16%.
Own software products 28% of revenue growth.
Considerable quarterly revenue decline at Applicon AB.
Decent YTD revenue growth.
Smaller revenue growth at Managed Services and Infrastructure.
✓
Profit margin of 26.8% versus 25.1% last year
Gross profit of ISK 1,142m versus ISK 1,000m in Q3 2020.
Operating costs of ISK 938m
✔
Operating costs as a percentage of revenue 22% versus 21.5% in the prior year
period
EBITDA of ISK 441m, up 30% from Q3 last year
EBITDA% is 10.4% versus 8.5% last year
Continued EBITDA increase in End-User Equipment and Related Services
EBITDA in Operational services and infrastructure solutions up from last year
Lower EBITDA at Applicon AB impacts the results of Software and Related Services
5.000
4.500
4.000
3.500 3.320
3.000
500
0
450
400
350
300
250
200
150
100
50
0
25
131
3.167
197
4.102
Q1 Q2 Q3
2018 2018
2018
3.553 3.493 3.463
280
237
213
Revenue
3.239
1
Q1 Q2 Q3 Q4 Q1 Q2 Q3 Q4 Q1 Q2 Q3 Q4 Q1 Q2 Q3
2018 2018 2018 2018 2019 2019 2019 2019 2020 2020 2020 2020 2021 2021 2021
254
4.336 4.277
EBITDA*
302
274
37
3.897
237
253
130
3.983
123
4.906
338
4.174
381
4.425
301
.origo.
357
4.257
441
Q2 Q3
Q4 Q1 Q2 Q3 Q4 Q1 Q2 Q3 Q4 Q1
2018 2019 2019 2019 2019 2020 2020 2020 2020 2021 2021 2021
6,9%
+30,34%View entire presentation