Goldman Sachs Results Presentation Deck
1.
2.
3.
4.
5.
6.
7.
8.
Footnotes
Annualized return on average common shareholders' equity (ROE) is calculated by dividing annualized net earnings applicable to common shareholders by average monthly common shareholders' equity. Annualized return
on average tangible common shareholders' equity (ROTE) is calculated by dividing annualized net earnings applicable to common shareholders by average monthly tangible common shareholders' equity. Tangible common
shareholders' equity is calculated as total shareholders' equity less preferred stock, goodwill and identifiable intangible assets. Tangible book value per common share (TBVPS) is calculated by dividing tangible common
shareholders' equity by basic shares. Management believes that tangible common shareholders' equity and TBVPS are meaningful because they are measures that the firm and investors use to assess capital adequacy and
that ROTE is meaningful because it measures the performance of businesses consistently, whether they were acquired or developed internally. Tangible common shareholders' equity, ROTE and TBVPS are non-GAAP
measures and may not be comparable to similar non-GAAP measures used by other companies.
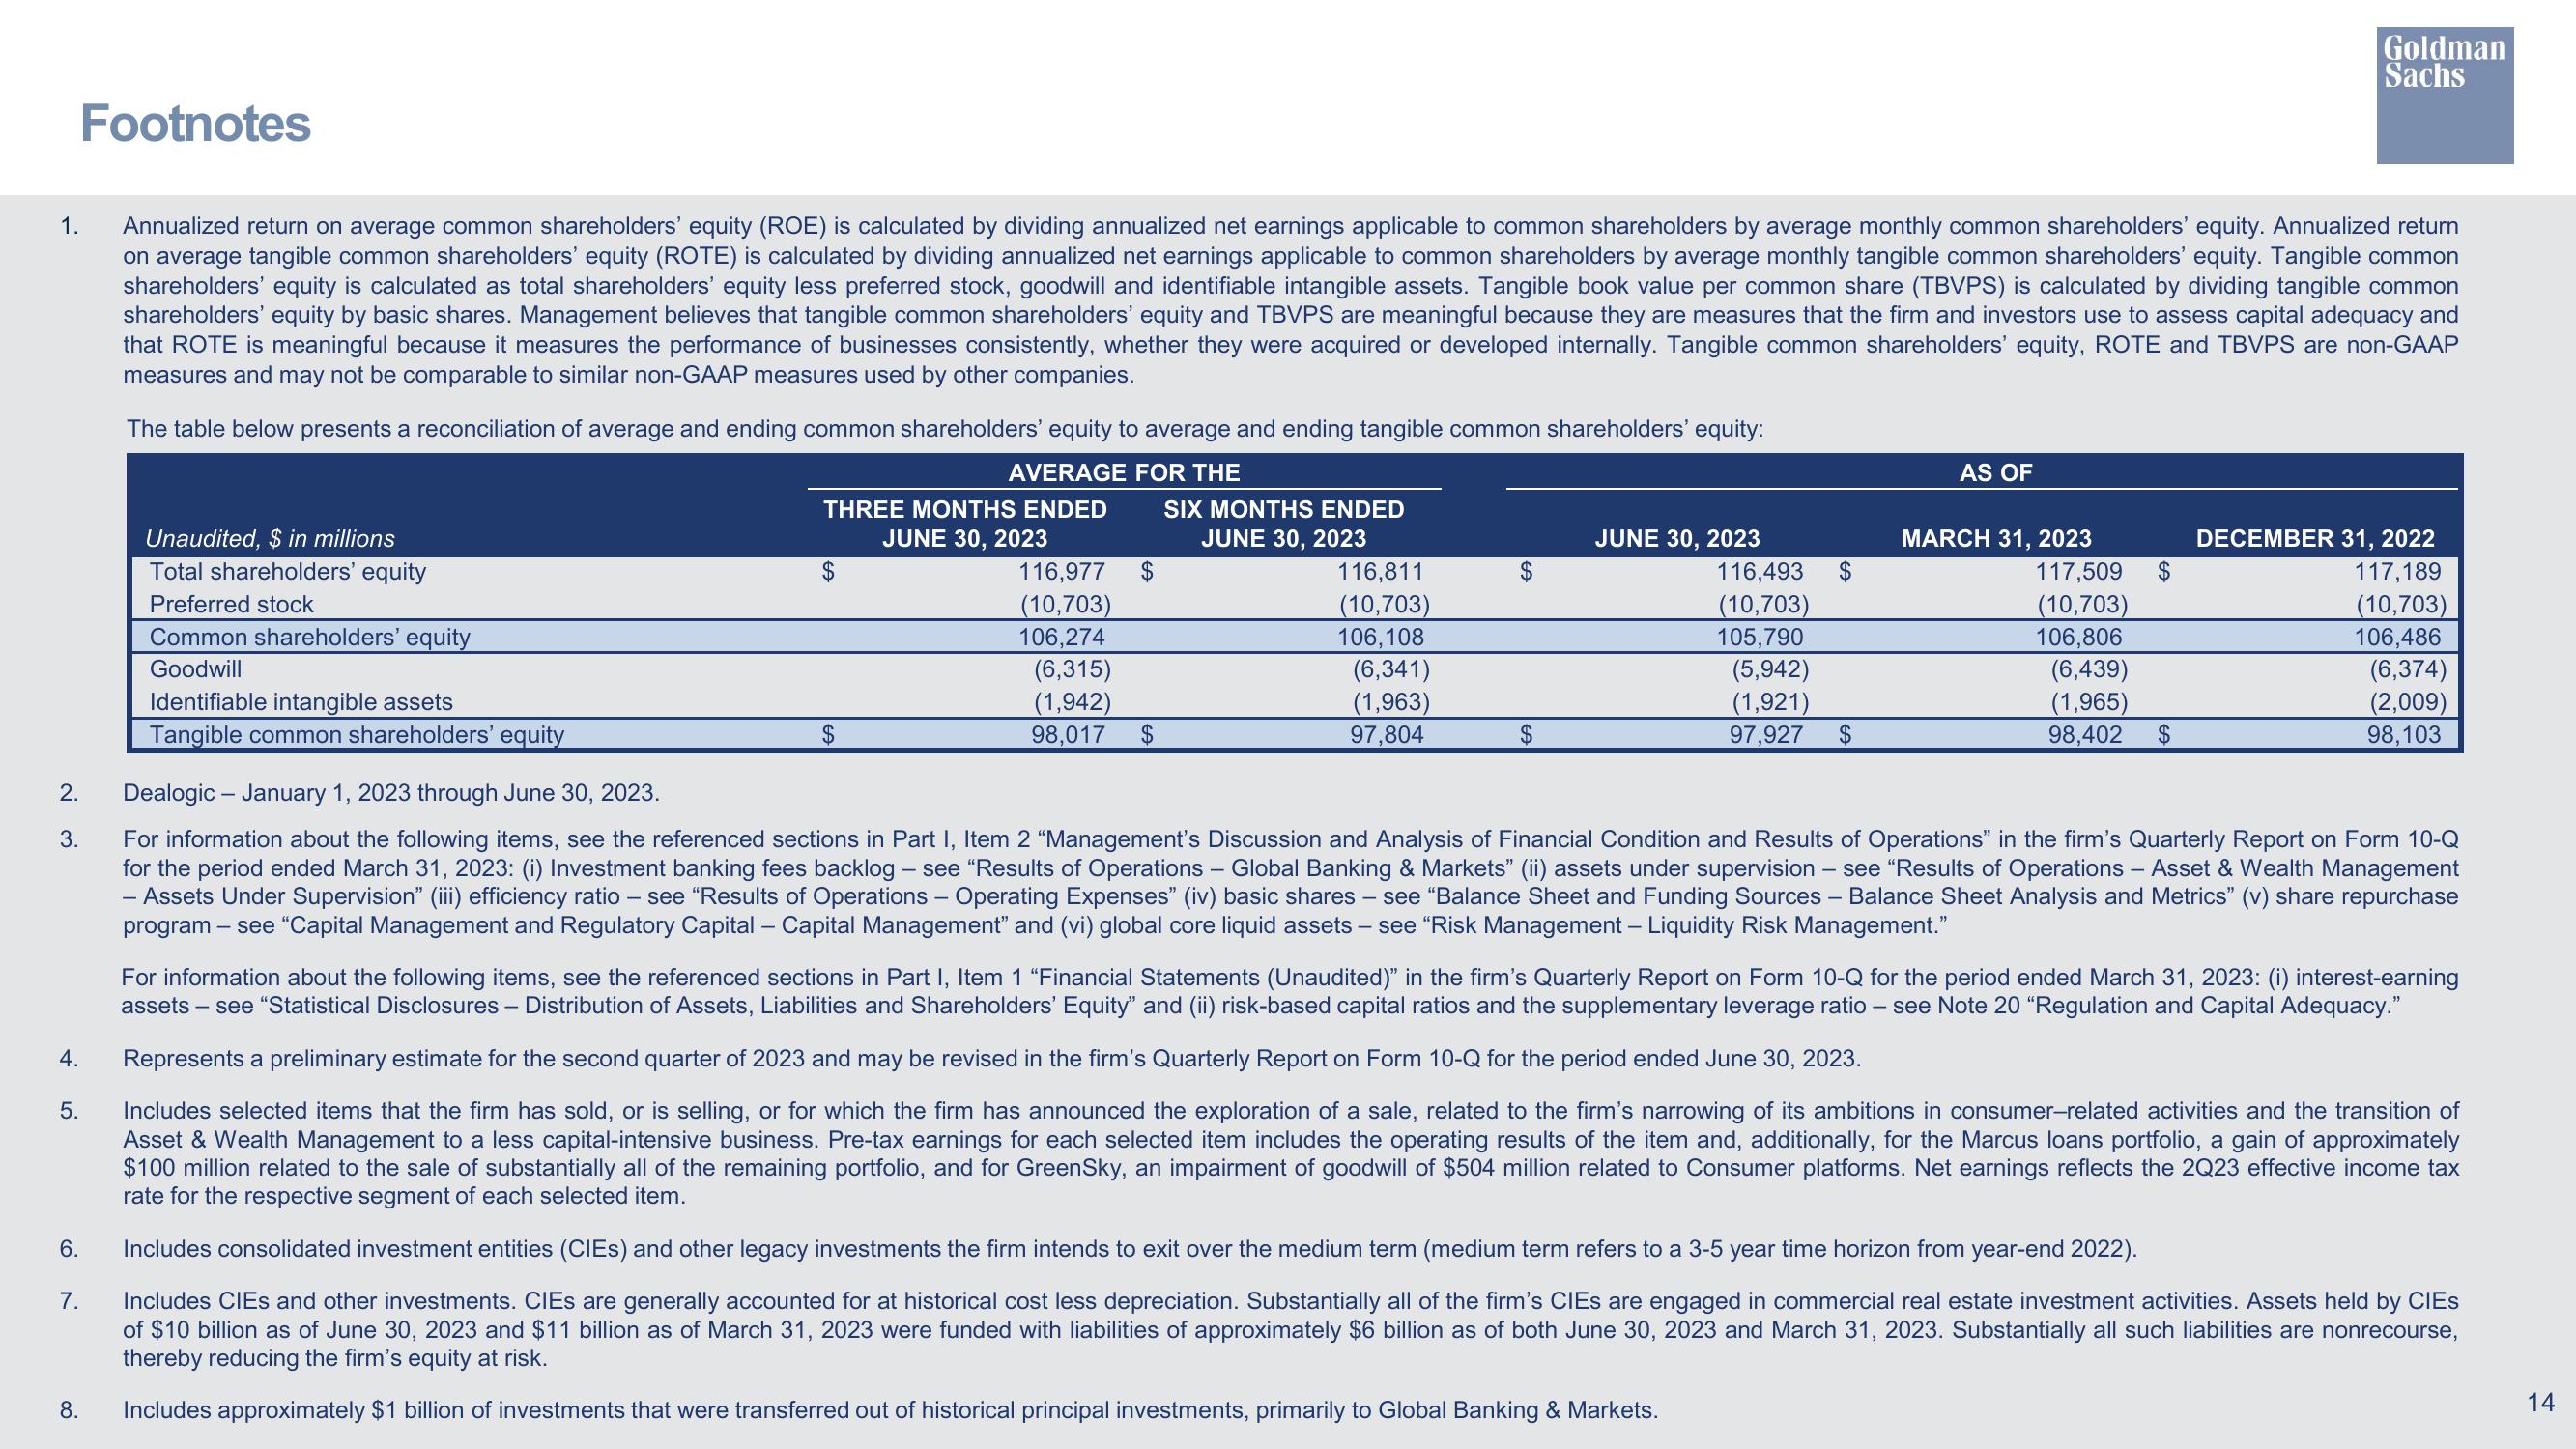
The table below presents a reconciliation of average and ending common shareholders' equity to average and ending tangible common shareholders' equity:
AVERAGE FOR THE
THREE MONTHS ENDED
JUNE 30, 2023
Unaudited, $ in millions
Total shareholders' equity
Preferred stock
Common shareholders' equity
Goodwill
Identifiable intangible assets
Tangible common shareholders' equity
$
$
116,977 $
(10,703)
106,274
(6,315)
(1,942)
98,017 $
SIX MONTHS ENDED
JUNE 30, 2023
116,811
(10,703)
106, 108
(6,341)
(1,963)
97,804
JUNE 30, 2023
116,493
(10,703)
105,790
(5,942)
(1,921)
$
97,927 $
AS OF
MARCH 31, 2023
117,509
(10,703)
106,806
(6,439)
(1,965)
$
Goldman
Sachs
98,402 $
DECEMBER 31, 2022
117,189
(10,703)
106,486
(6,374)
(2,009)
98,103
Dealogic - January 1, 2023 through June 30, 2023.
For information about the following items, see the referenced sections in Part I, Item 2 "Management's Discussion and Analysis of Financial Condition and Results of Operations" in the firm's Quarterly Report on Form 10-Q
for the period ended March 31, 2023: (i) Investment banking fees backlog - see "Results of Operations - Global Banking & Markets" (ii) assets under supervision - see "Results of Operations - Asset & Wealth Management
- Assets Under Supervision" (iii) efficiency ratio - see "Results of Operations - Operating Expenses" (iv) basic shares - see "Balance Sheet and Funding Sources - Balance Sheet Analysis and Metrics" (v) share repurchase
program - see "Capital Management and Regulatory Capital - Capital Management" and (vi) global core liquid assets – see "Risk Management - Liquidity Risk Management."
For information about the following items, see the referenced sections in Part I, Item 1 "Financial Statements (Unaudited)" in the firm's Quarterly Report on Form 10-Q for the period ended March 31, 2023: (i) interest-earning
assets - see "Statistical Disclosures - Distribution of Assets, Liabilities and Shareholders' Equity" and (ii) risk-based capital ratios and the supplementary leverage ratio - see Note 20 "Regulation and Capital Adequacy."
Represents a preliminary estimate for the second quarter of 2023 and may be revised in the firm's Quarterly Report on Form 10-Q for the period ended June 30, 2023.
Includes selected items that the firm has sold, or is selling, or for which the firm has announced the exploration of a sale, related to the firm's narrowing of its ambitions in consumer-related activities and the transition of
Asset & Wealth Management to a less capital-intensive business. Pre-tax earnings for each selected item includes the operating results of the item and, additionally, for the Marcus loans portfolio, a gain of approximately
$100 million related to the sale of substantially all of the remaining portfolio, and for GreenSky, an impairment of goodwill of $504 million related to Consumer platforms. Net earnings reflects the 2Q23 effective income tax
rate for the respective segment of each selected item.
Includes consolidated investment entities (CIES) and other legacy investments the firm intends to exit over the medium term (medium term refers to a 3-5 year time horizon from year-end 2022).
Includes CIEs and other investments. CIEs are generally accounted for at historical cost less depreciation. Substantially all of the firm's CIEs are engaged in commercial real estate investment activities. Assets held by CIEs
of $10 billion as of June 30, 2023 and $11 billion as of March 31, 2023 were funded with liabilities of approximately $6 billion as of both June 30, 2023 and March 31, 2023. Substantially all such liabilities are nonrecourse,
thereby reducing the firm's equity at risk.
Includes approximately $1 billion of investments that were transferred out of historical principal investments, primarily to Global Banking & Markets.
14View entire presentation