Matson Results Presentation Deck
5
Hawaii Service - Current Business Trends
Unemployment Rate
Select Hawaii Economic Indicators
9.0%
8.0%
7.0%
6.0%
5.0%
4.0%
3.0%
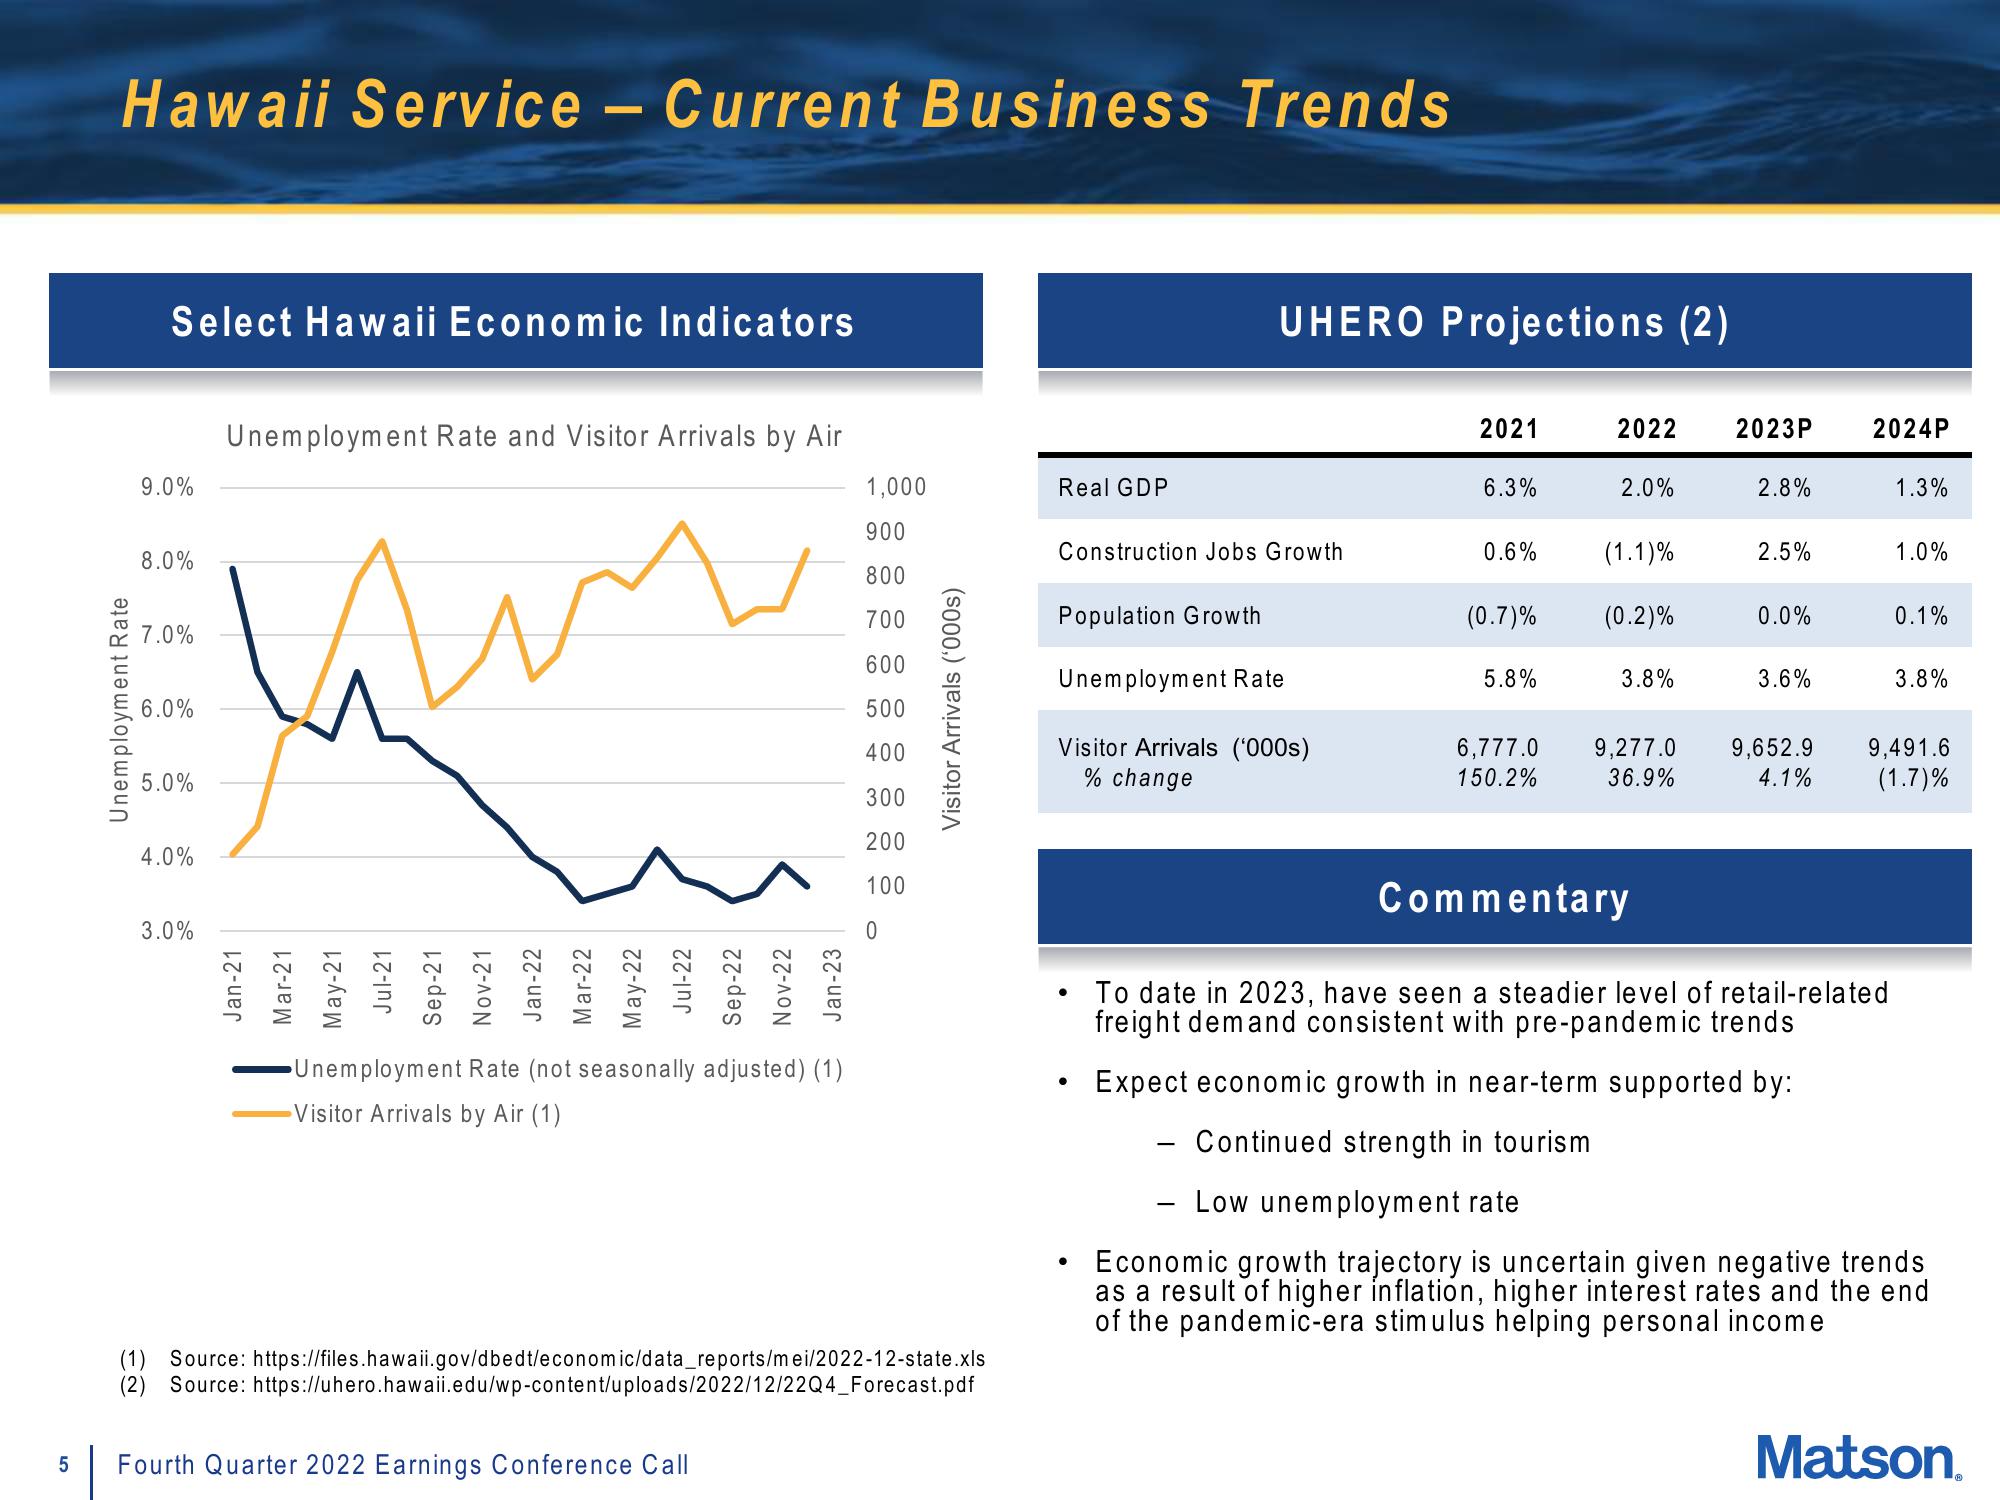
Unemployment Rate and Visitor Arrivals by Air
ин
Jan-21
Mar-21
May-21
Jul-21
A
Sep-21
Nov-21
Jan-22
Mar-22
May-22
Jul-22
Sep-22
Nov-22
Jan-23
Unemployment Rate (not seasonally adjusted) (1)
Visitor Arrivals by Air (1)
1,000
900
800
700
600
500
400
300
200
100
0
Fourth Quarter 2022 Earnings Conference Call
Visitor Arrivals ('000s)
(1) Source: https://files.hawaii.gov/dbedt/economic/data_reports/mei/2022-12-state.xls
(2) Source: https://uhero.hawaii.edu/wp-content/uploads/2022/12/22Q4_Forecast.pdf
Real GDP
Construction Jobs Growth
Population Growth
UHERO Projections (2)
Unemployment Rate
Visitor Arrivals ('000s)
% change
●
●
2021
6.3%
0.6%
(0.7)%
5.8%
6,777.0
150.2%
2022 2023P
2.0%
(1.1)%
(0.2)%
3.8%
9,277.0
36.9%
2.8%
2.5%
0.0%
3.6%
9,652.9
4.1%
2024P
1.3%
Commentary
To date in 2023, have seen a steadier level of retail-related
freight demand consistent with pre-pandemic trends
Expect economic growth in near-term supported by:
Continued strength in tourism
1.0%
0.1%
3.8%
9,491.6
(1.7)%
Low unemployment rate
Economic growth trajectory is uncertain given negative trends
as a result of higher inflation, higher interest rates and the end
of the pandemic-era stimulus helping personal income
Matson.View entire presentation