J.P.Morgan 2Q23 Investor Results
JPMORGAN CHASE & CO.
ASSET & WEALTH MANAGEMENT
FINANCIAL HIGHLIGHTS, CONTINUED
(in millions, except ratio data)
SELECTED BALANCE SHEET DATA (period-end)
Total assets
Loans
Deposits
Equity
SELECTED BALANCE SHEET DATA (average)
Total assets
Loans
Deposits
Equity
CREDIT DATA AND QUALITY STATISTICS
Net charge-offs/(recoveries)
Nonaccrual loans
Allowance for credit losses:
Allowance for loan losses
Allowance for lending-related commitments
Total allowance for credit losses
Net charge-off/(recovery) rate
Allowance for loan losses to period-end loans
Allowance for loan losses to nonaccrual loans
Nonaccrual loans to period-end loans
$ 247,118
$
2Q23
$
222,493 (a)
199,763
17,000
238,987
219,469 (b)
211,872
16,670
2
615
649
39
688
0.29
106
0.28
%
1Q23
$ 232,516
211,140
225,831
16,000
$ 228,823
211,469
224,354
16,000
$
(2)
477
526
19
545
0.25
110
0.23
%
4Q22
$ 232,037
214,006
233,130
17,000
$ 230,149
214,150
236,965
17,000
$
(2)
459
494
20
514
0.23
108
0.21
QUARTERLY TRENDS
%
3Q22
$ 232,303
214,989
242,315
17,000
$ 232,748
216,714
253,026
17,000
$
(13)
467
461
21
482
(0.02)
0.21
99
0.22
%
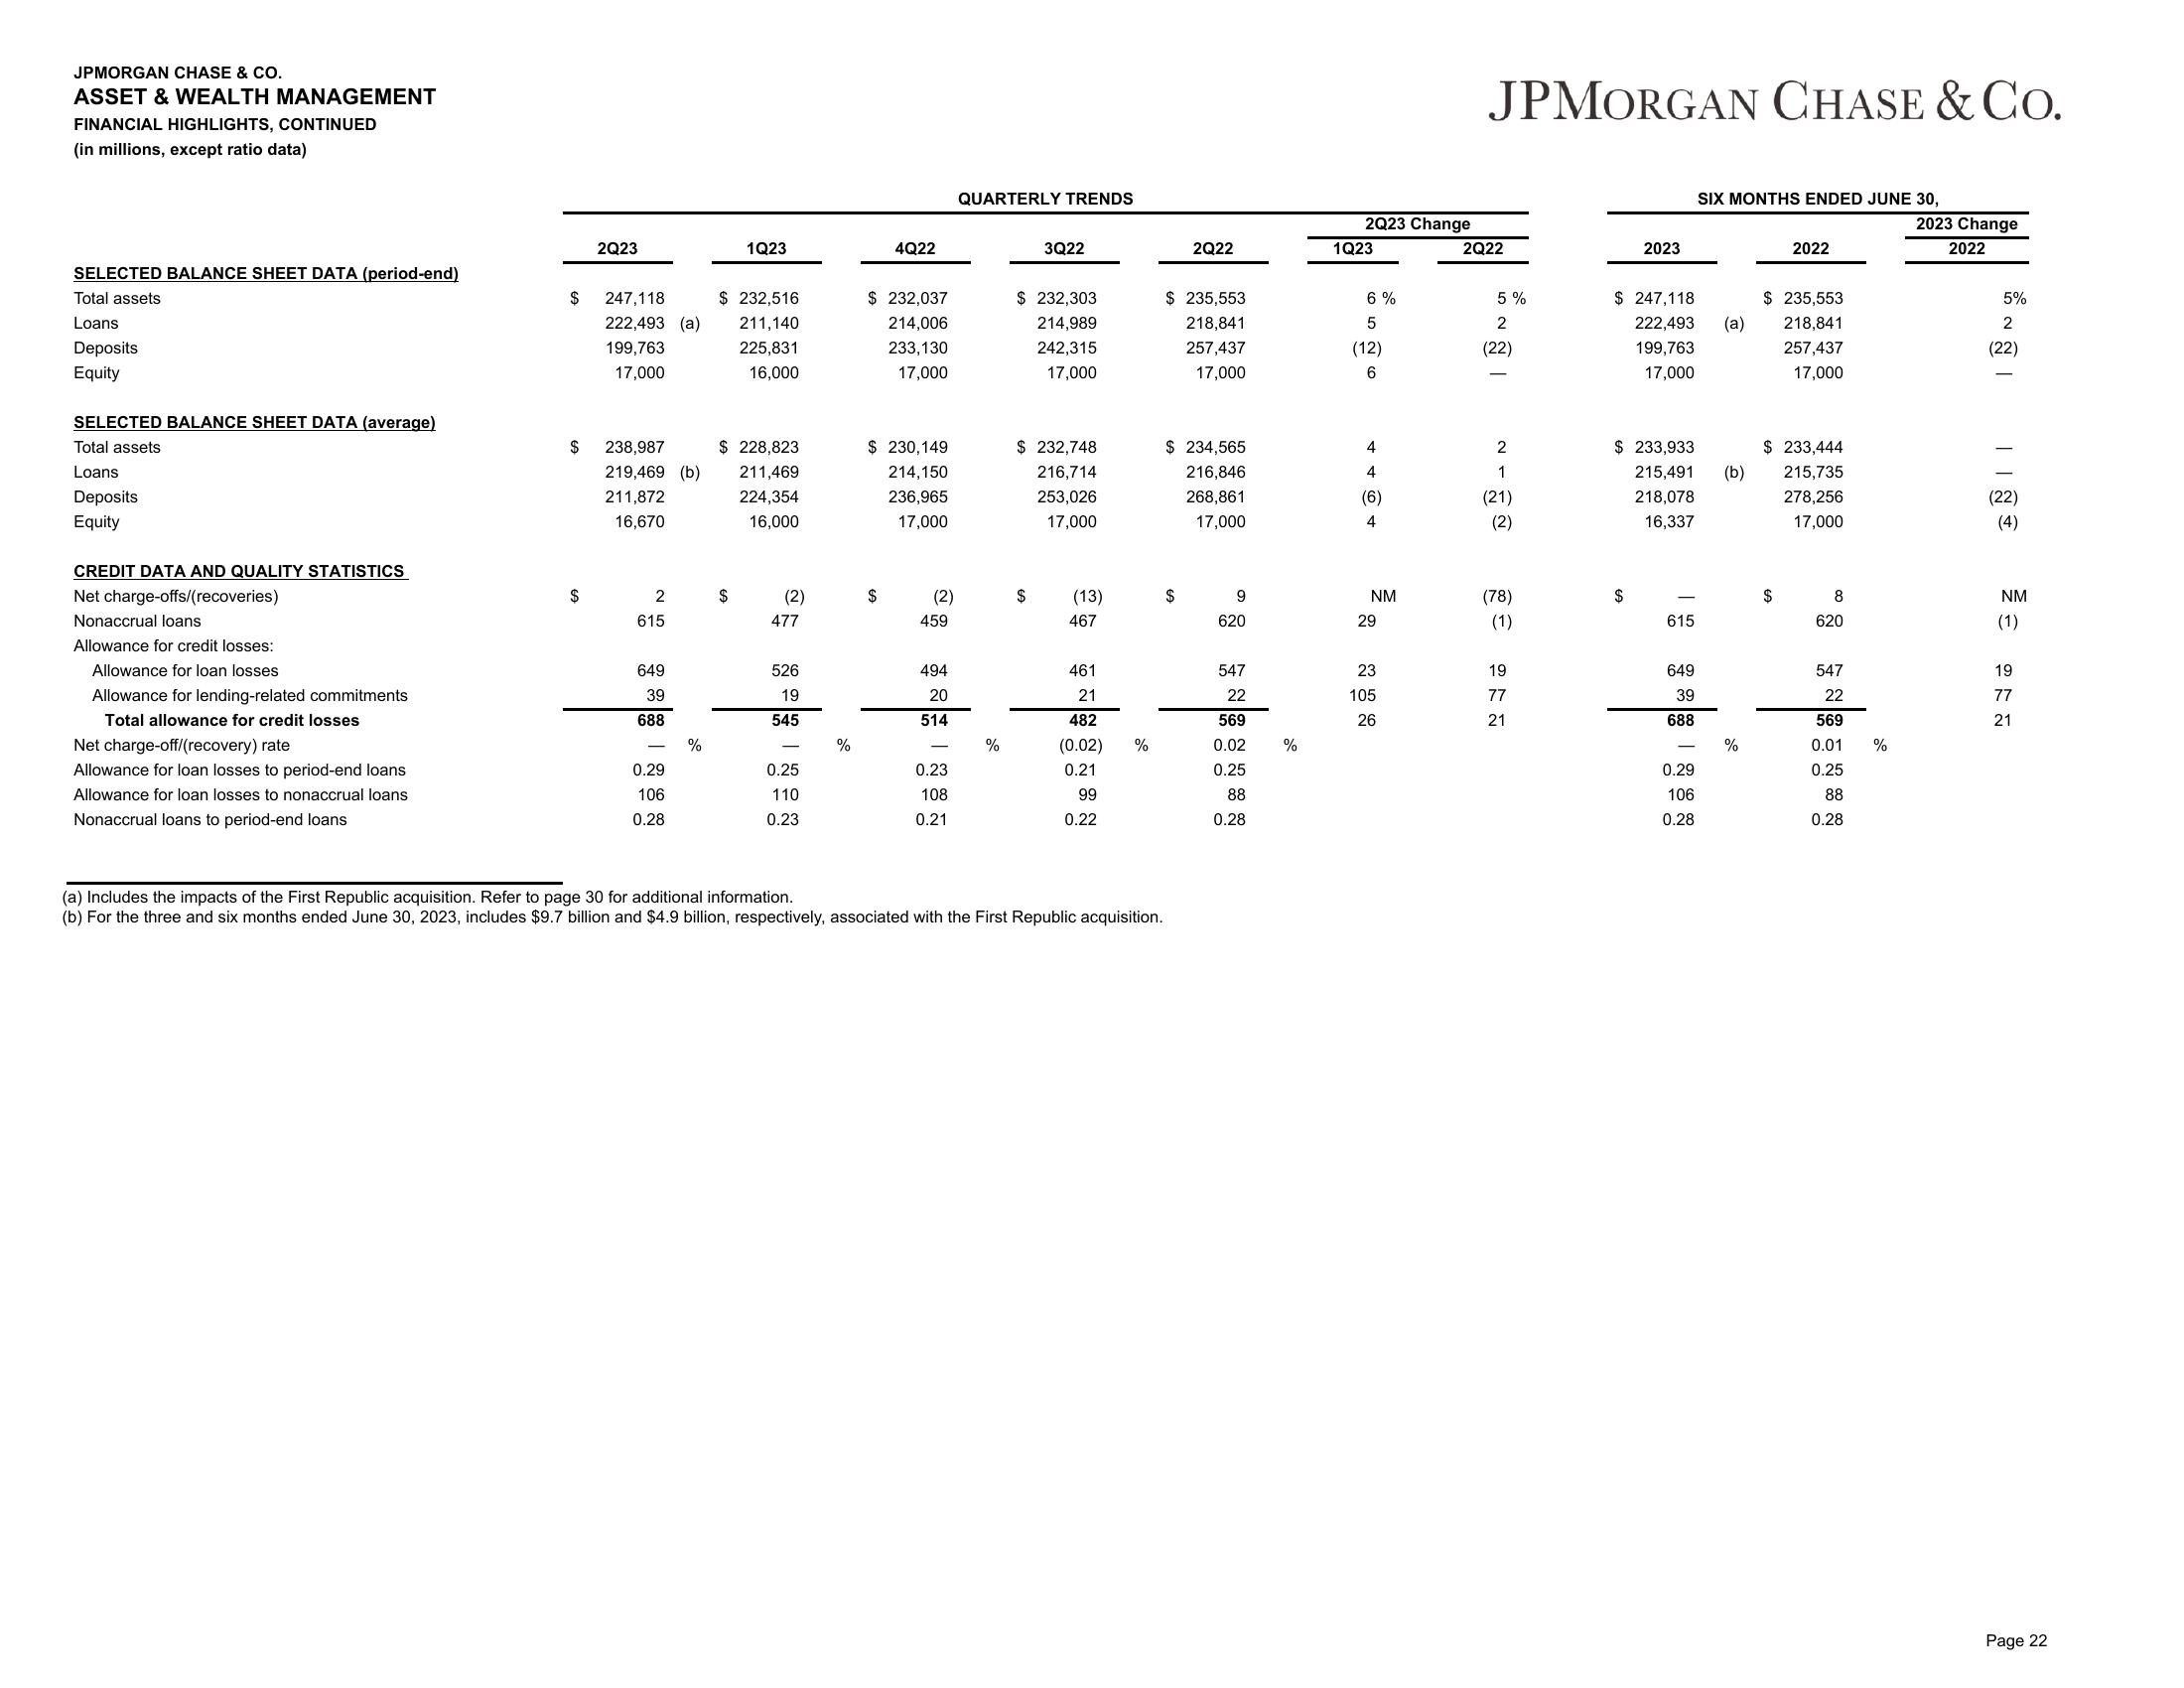
(a) Includes the impacts of the First Republic acquisition. Refer to page 30 for additional information.
(b) For the three and six months ended June 30, 2023, includes $9.7 billion and $4.9 billion, respectively, associated with the First Republic acquisition.
2Q22
$ 235,553
218,841
257,437
17,000
$ 234,565
216,846
268,861
17,000
$
9
620
547
22
569
0.02
0.25
88
0.28
%
2Q23 Change
1Q23
6%
5
(12)
6
4
4
(6)
4
NM
29
23
105
26
JPMORGAN CHASE & CO.
2Q22
5%
2
(22)
2
1
(21)
(2)
(78)
(1)
19
77
21
2023
$ 247,118
222,493
199,763
17,000
$ 233,933
215,491
218,078
16,337
$
615
649
39
688
0.29
106
0.28
SIX MONTHS ENDED JUNE 30,
(a)
(b)
%
2022
$ 235,553
218,841
257,437
17,000
$ 233,444
215,735
278,256
17,000
$
8
620
547
22
569
0.01
0.25
88
0.28
%
2023 Change
2022
5%
2
(22)
(22)
(4)
NM
(1)
19
77
21
Page 22View entire presentation