flyExclusive SPAC
V. FINANCIAL OVERVIEW
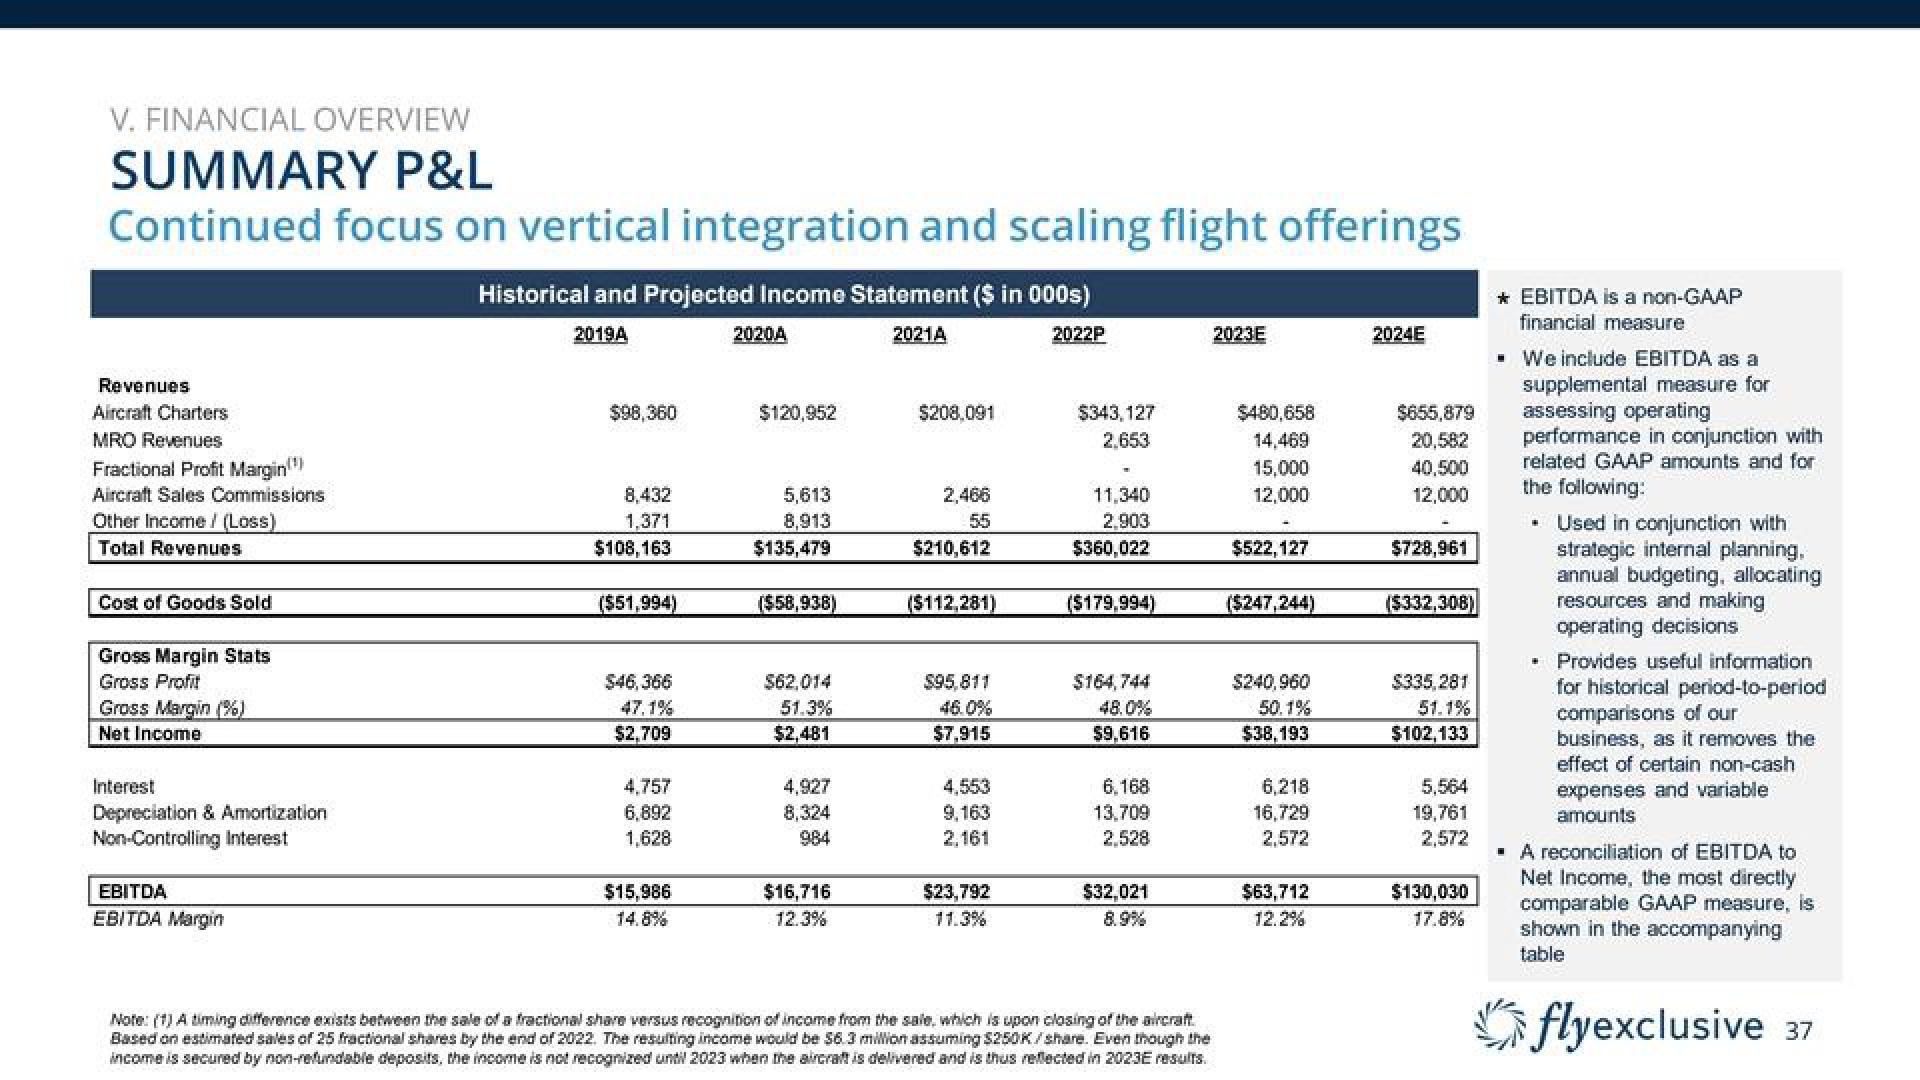
SUMMARY P&L
Continued focus on vertical integration and scaling flight offerings
Revenues
Aircraft Charters
MRO Revenues
Fractional Profit Margin(¹)
Aircraft Sales Commissions
Other Income / (Loss)
Total Revenues
Cost of Goods Sold
Gross Margin Stats
Gross Profit
Gross Margin (%)
Net Income
Interest
Depreciation & Amortization
Non-Controlling Interest
EBITDA
EBITDA Margin
Historical and Projected Income Statement ($ in 000s)
2019A
2021A
2022P
$98,360
8,432
1,371
$108,163
($51,994)
$46,366
47.1%
$2,709
4,757
6,892
1,628
$15,986
14.8%
2020A
$120,952
5,613
8,913
$135,479
($58,938)
$62,014
51.3%
$2,481
4,927
8,324
984
$16,716
12.3%
$208.091
2,466
55
$210,612
($112,281)
$95.811
46.0%
$7,915
4,553
9,163
2,161
$23,792
11.3%
$343,127
2.653
11,340
2,903
$360,022
($179,994)
$164,744
48.0%
$9,616
6.168
13.709
2,528
$32,021
8.9%
Note: (1) A timing difference exists between the sale of a fractional share versus recognition of income from the sale, which is upon closing of the aircraft.
Based on estimated sales of 25 fractional shares by the end of 2022. The resulting income would be $6.3 million assuming $250K/share. Even though the
income is secured by non-refundable deposits, the income is not recognized until 2023 when the aircraft is delivered and is thus reflected in 2023E results.
2023E
$480,658
14,469
15,000
12,000
$522,127
($247,244)
$240,960
50.1%
$38,193
6,218
16,729
2,572
$63,712
12.2%
2024E
$655,879
20,582
40,500
12,000
$728,961
($332,308)
$335,281
51.1%
$102,133
5,564
19,761
2,572
$130,030
17.8%
* EBITDA is a non-GAAP
financial measure
. We include EBITDA as a
supplemental measure for
assessing operating
performance in conjunction with
related GAAP amounts and for
the following:
#
Used in conjunction with
strategic internal planning,
annual budgeting, allocating
resources and making
operating decisions
• Provides useful information
for historical period-to-period
comparisons of our
business, as it removes the
effect of certain non-cash
expenses and variable
amounts
A reconciliation of EBITDA to
Net Income, the most directly
comparable GAAP measure, is
shown in the accompanying
table
flyexclusive 37View entire presentation