Privia Health IPO Presentation Deck
7
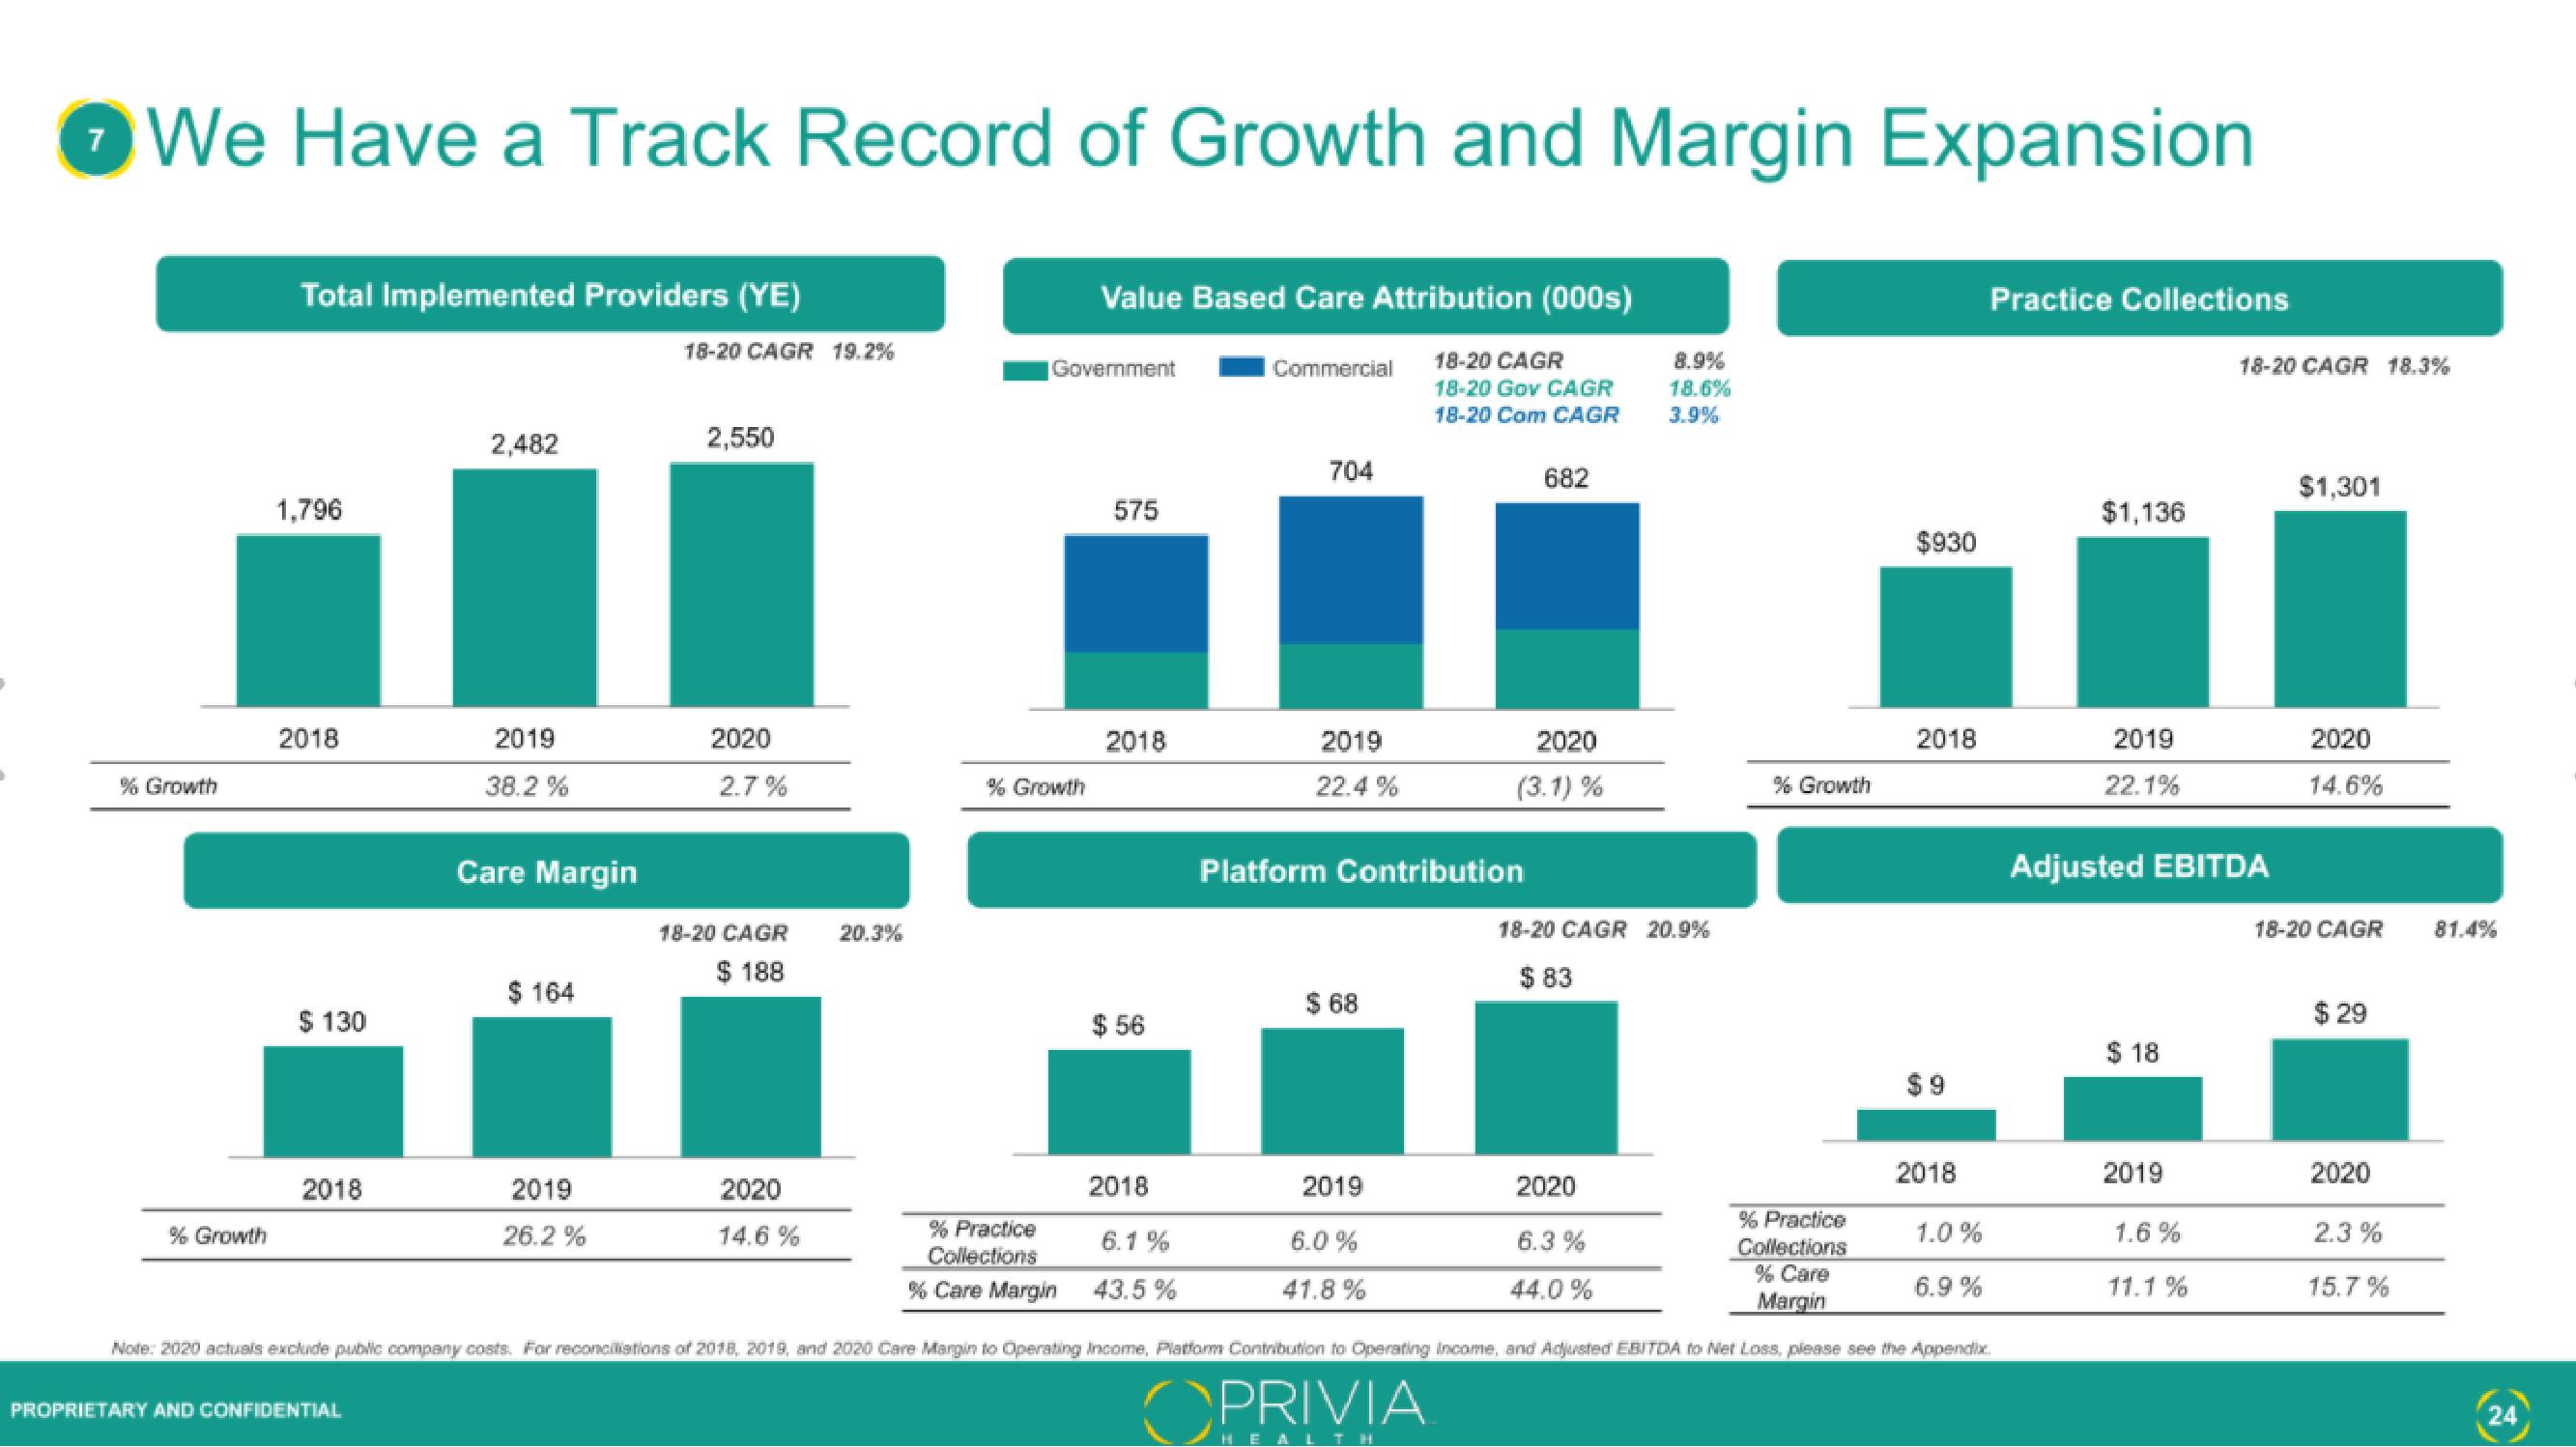
We Have a Track Record of Growth and Margin Expansion
% Growth
% Growth
Total Implemented Providers (YE)
1,796
2018
$ 130
2018
2,482
PROPRIETARY AND CONFIDENTIAL
2019
38.2 %
Care Margin
$ 164
2019
26.2%
18-20 CAGR 19.2%
2,550
2020
2.7%
18-20 CAGR
$ 188
2020
14.6 %
20.3%
Value Based Care Attribution (000s)
18-20 CAGR
18-20 Gov CAGR
18-20 Com CAGR
Government
% Growth
575
2018
$ 56
2018
% Practice
Collections
6.1%
% Care Margin 43.5 %
Commercial
704
2019
22.4 %
Platform Contribution
$ 68
2019
6.0%
41.8%
682
2020
(3.1) %
8.9%
18.6%
3.9%
18-20 CAGR 20.9%
$ 83
2020
6.3%
44.0%
% Growth
% Practice
Collections
% Care
Margin
$930
2018
$9
2018
1.0%
6.9%
Note: 2020 actuals exclude public company costs. For reconciliations of 2018, 2019, and 2020 Care Margin to Operating Income, Platform Contribution to Operating Income, and Adjusted EBITDA to Net Loss, please see the Appendix
OPRIVIA
Practice Collections
$1,136
2019
22.1%
Adjusted EBITDA
$ 18
2019
18-20 CAGR 18.3%
1.6%
11.1%
$1,301
2020
14.6%
18-20 CAGR
$ 29
2020
2.3 %
15.7%
81.4%
24View entire presentation