Melrose Results Presentation Deck
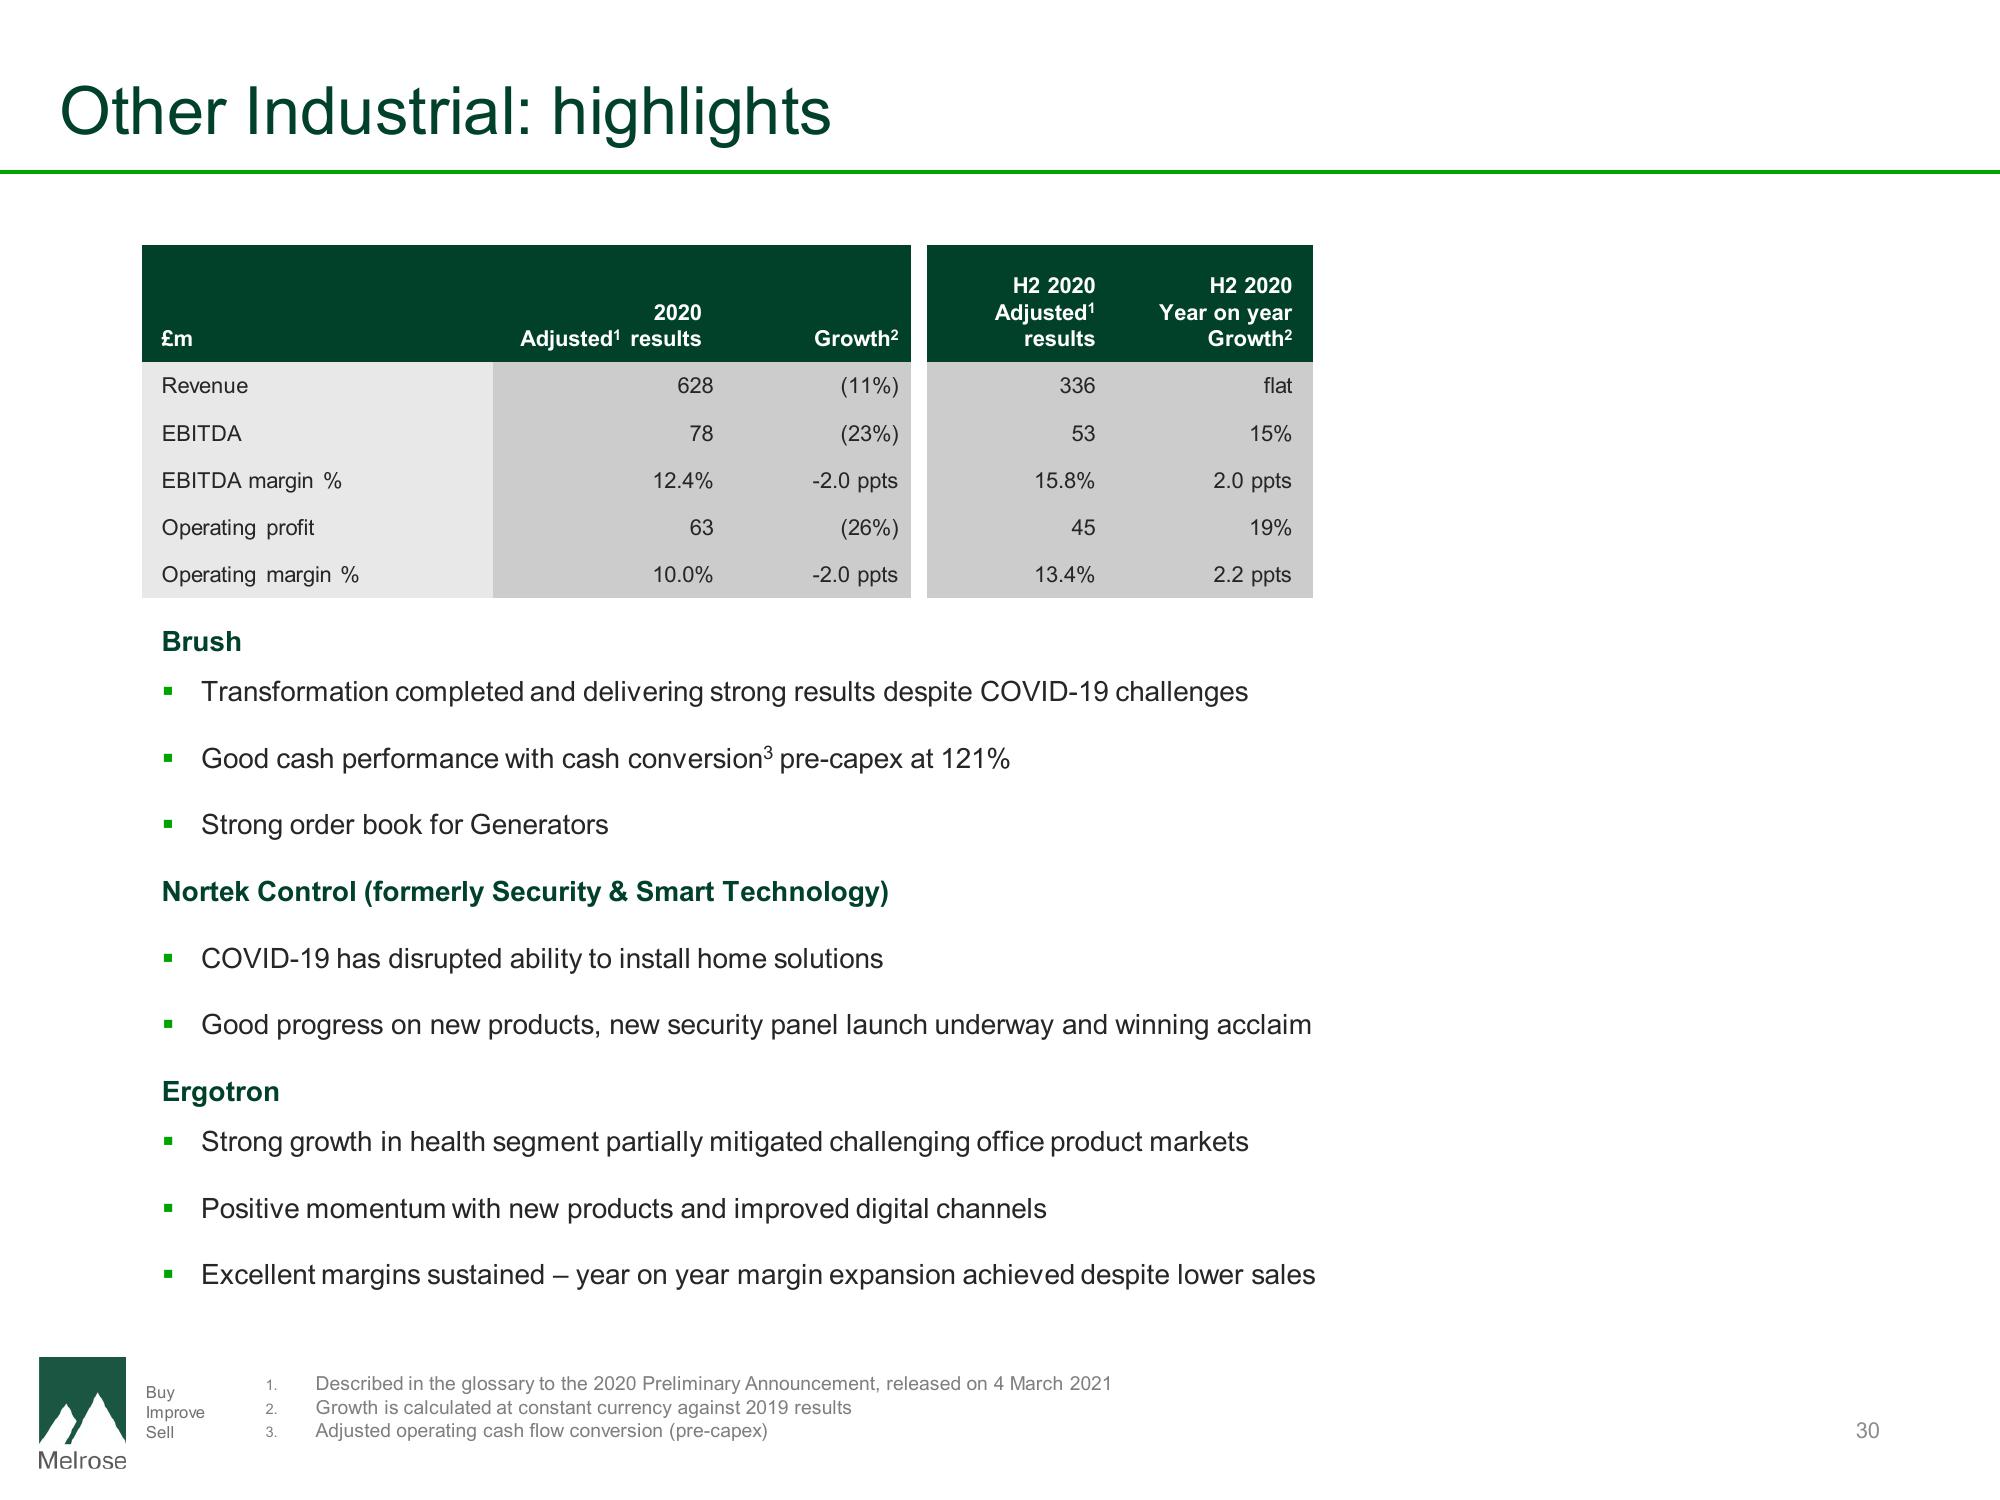
Other Industrial: highlights
Melrose
£m
Revenue
EBITDA
EBITDA margin %
Operating profit
Operating margin %
Brush
I
■
■
Buy
Improve
Sell
2020
Adjusted¹ results
1.
2.
3.
628
78
12.4%
63
10.0%
Growth²
(11%)
(23%)
-2.0 ppts
(26%)
-2.0 ppts
H2 2020
Adjusted¹
results
336
53
15.8%
45
13.4%
Transformation completed and delivering strong results despite COVID-19 challenges
Good cash performance with cash conversion³ pre-capex at 121%
Strong order book for Generators
Nortek Control (formerly Security & Smart Technology)
COVID-19 has disrupted ability to install home solutions
Good progress on new products, new security panel launch underway and winning acclaim
Ergotron
Strong growth in health segment partially mitigated challenging office product markets
Positive momentum with new products and improved digital channels
Excellent margins sustained - year on year margin expansion achieved despite lower sales
H2 2020
Year on year
Growth²
Described in the glossary to the 2020 Preliminary Announcement, released on 4 March 2021
Growth is calculated at constant currency against 2019 results
Adjusted operating cash flow conversion (pre-capex)
flat
15%
2.0 ppts
19%
2.2 ppts
30View entire presentation